

In the spring of 2002, the Oakland Athletics had one of the lowest payrolls in baseball and a general manager convinced the scouts were measuring the wrong things. That season, the A’s won 20 games in a row. Moneyball made the lesson permanent: the organization that measures better, decides better. And the one that decides better, performs better.
The same principle applies to IT service management. Data alone doesn’t improve performance. The value comes from understanding which metrics matter and using them to guide better decisions. That’s exactly where ServiceNow Performance Analytics comes in, giving organisations the tools to measure performance over time instead of relying on isolated reports.
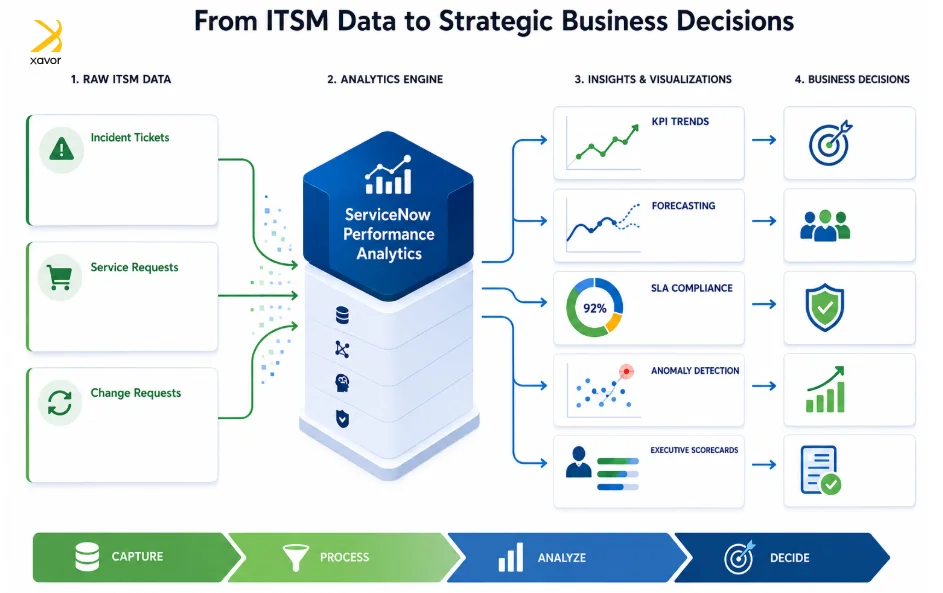
Every incident, request, and change moving through the ServiceNow ITSM platform leaves a trail. ServiceNow Performance Analytics is the application that turns that trail into decisions. As part of the broader ServiceNow Analytics services, it helps IT teams transform operational data into measurable business outcomes.
What ServiceNow Performance Analytics Actually Does
Performance Analytics is a native application on the ServiceNow platform. It collects scheduled snapshots of the metrics you care about, stores them over time, and builds the trend lines, forecasts, and dashboards that tell you where service delivery is headed.
The building blocks:
- Indicators define what you measure: incident backlog, mean time to resolve, SLA attainment, first-contact resolution.
- Breakdowns slice each indicator by assignment group, category, priority, or location, so you can see which part of the operation is moving the number.
- Targets and thresholds define what acceptable looks like. Automated alerts fire when performance drifts, before anyone files a complaint.
- Analytics Hub and forecasting project each KPI forward from its own history, so capacity conversations happen months early instead of weeks late.
ServiceNow performance analytics includes over 250 pre-built KPIs and out-of-the-box dashboards for ITSM. Instead of building reports from scratch, organizations can start tracking performance using the data already stored in their ServiceNow instance—without exporting data or relying on separate BI tools.
Why Traditional ITSM Reporting Falls Short
| Features | Standard ServiceNow reporting | ServiceNow Performance Analytics |
| How it reads data | Live query at the moment you run it | Scheduled snapshots stored over time |
| Question it answers | What is true right now? | Where is this headed? |
| Forecasting | None | Projections from each KPI’s own history |
| Alerts | Someone has to look | Automatic, threshold-based |
| Anomaly detection | Manual, if at all | Flagged against the trend |
| Built for | Daily operations | Executives and service owners |
| Output | A number | A trajectory and a decision |
The first mistake many organizations make is assuming reporting and analytics are interchangeable. Traditional ServiceNow reports tell you what happened. How many incidents were opened this week? Which assignment group breached the most SLAs? How many change requests were completed?
Those numbers are useful, but they’re snapshots. They answer operational questions in the present moment without explaining whether service delivery is improving, stagnating, or quietly drifting in the wrong direction.
Performance Analytics changes the conversation by preserving historical snapshots and turning them into trends, forecasts, and performance indicators. Instead of reacting to yesterday’s numbers, IT leaders can identify patterns, anticipate bottlenecks, and intervene before service quality declines.
5 Reasons Performance Analytics Should Be Part of Every ITSM Strategy
1. It Turns ITSM from Reactive to Predictive
Most IT teams discover problems after users do.
Performance Analytics tracks KPIs over time and highlights emerging trends before they become service disruptions. A gradual increase in incident backlog or declining SLA performance may seem insignificant in isolation, but trend analysis exposes patterns early enough to take corrective action. Built-in forecasting extends that visibility even further, helping teams plan capacity and resources before performance deteriorates.
2. It Aligns IT Operations with Business Outcomes
Executives don’t want dashboards filled with ticket counts. They want to know whether IT is improving employee productivity, supporting business growth, and meeting service commitments.
Performance Analytics connects operational metrics with business objectives through KPIs, targets, thresholds, and scorecards. Instead of measuring activity, organizations begin measuring progress. That shift makes ServiceNow modules far more useful at the leadership level.
3. It Helps Teams Prioritize What Actually Matters
Every IT team has limited resources. Without historical context, it’s easy to spend time and resources solving the loudest problem instead of the most important one.
Breakdowns, trend analysis, and Analytics Hub help identify which services, business units, locations, or assignment groups are driving performance changes. That visibility enables managers to allocate people, and automation efforts where they’ll have the greatest impact.
4. It Creates a Culture of Continual Improvement
Continual Service Improvement is one of ITIL’s foundational principles, yet many organizations struggle to operationalize it.
Performance Analytics embeds continuous measurement directly into the ServiceNow platform. Teams can monitor progress against targets, detect anomalies automatically, and measure whether process improvements actually deliver better outcomes over time instead of relying on assumptions.
5. It Delivers Value Without Creating Another Analytics Silo
Many organizations export ServiceNow data into external BI service platforms before meaningful analysis can begin.
That introduces delays, duplicate data, governance challenges, and additional maintenance.
Because performance analytics is native to ServiceNow, it works directly with operational data already living inside the platform. Dashboards, scorecards, forecasts, and drill-down capabilities remain contextual, secure, and immediately actionable without requiring a separate analytics ecosystem.
Best Practices for Using Performance Analytics
Getting started with ServiceNow performance analytics doesn’t have to be complicated. By focusing on the right KPIs, building meaningful dashboards, and reviewing performance regularly, you can maximise the value of your analytics from day one. Here are some best practices to help you get started:
Prepare
- Define KPIs that align with your business goals.
- Start with a high-impact process, such as Incident or Change Management.
- Validate your data before building dashboards to ensure accurate reporting.
Build
- Create role-based dashboards tailored to different users.
- Automate data collection to keep metrics up to date.
- Configure targets and thresholds to monitor performance effectively.
Assess
- Review trends regularly to identify improvement opportunities.
- Refine KPIs and dashboards as business priorities evolve.
- Use performance data to support continual service improvement.
Common Mistakes Organizations Make
Performance Analytics is powerful, but technology alone doesn’t create value. Some of the most common implementation pitfalls include:
- Tracking too many KPIs instead of focusing on business-critical outcomes.
- Measuring activity instead of performance.
- Building dashboards without defining clear targets or thresholds.
- Treating performance analytics as an executive reporting tool instead of an operational decision-making platform.
- Failing to review KPIs regularly as business priorities evolve.
The most successful implementations begin with business objectives and work backward to identify the metrics that matter.
How Xavor Can Help
Getting value from performance analytics depends on more than enabling the application. Organizations need the right KPIs, meaningful targets, well-designed dashboards, and governance that keeps reporting aligned with changing business priorities.
Xavor helps organizations implement and optimize ServiceNow performance analytics to deliver measurable outcomes. Our ServiceNow expertise includes:
- ServiceNow consulting and strategy
- ITSM implementation and optimisation
- Platform customisation and workflow automation
- Integration with enterprise applications
- Dashboard, reporting, and performance analytics configuration
- Platform governance, health checks, and ongoing support
Conclusion
ServiceNow Performance Analytics gives IT leaders the visibility to identify trends early, monitor progress against meaningful objectives, and make informed decisions with confidence. By turning operational data into measurable performance insights, it helps organisations strengthen service delivery and support continual improvement across the ITSM lifecycle.
For organisations looking to maximise the value of their ServiceNow investment, Performance Analytics has become a core capability for driving smarter decisions, improving operational performance, and aligning IT services with business priorities. If you’re ready to get the most from ServiceNow Performance Analytics, contact our team at [email protected].

FAQs
ServiceNow Performance Analytics is a tool that helps organisations track IT performance over time. It measures key metrics (KPIs), shows trends, and helps teams make better decisions using historical data.
No. Performance Analytics is a separately licensed ServiceNow product. The features available depend on your ServiceNow licensing agreement.
ServiceNow Reporting shows current data, while Performance Analytics tracks historical performance. This makes it easier to monitor trends, measure progress, and forecast future performance.