
On August 1, 2012, Knight Capital Group deployed a routine software update to its trading system. The deployment script failed silently on one of eight servers, reported success, and nobody noticed. Before the team understood what was happening, the system had executed over 4 million trades, accumulated $7 billion in unintended positions, and lost $460 million in 45 minutes. The company ceased to exist shortly after.
The most damning detail from the SEC investigation was that 97 automated alert emails fired before the market even opened. They went unread because the system had no observability layer that made those signals impossible to miss.
Knight Capital is the extreme version. But the same pattern plays out every week in production systems across industries. Many times, a deployment succeeds. Old behavior resurfaces quietly. No alert fires that anyone acts on. And by the time someone notices, the blast radius is already wide.
That first number is the one worth focusing on. Most production failures that reach users first are application-layer events that creep over days, business logic errors hiding behind 200 responses.
These are catchable. Datadog catches them.
Let’s see how in this blog.
What is Datadog?
Datadog is a monitoring and observability platform. It pulls in the likes of logs and metrics from your data sources, such as:
- Infrastructure
- Applications
- Services
Everything is united in one place, so you can see what’s actually happening across a system instead of guessing from scattered dashboards.
For engineering organizations running distributed, cloud-native stacks, that visibility matters a lot. A request today might touch a dozen microservices, three databases, and a queue or two before it returns a response.
When something goes wrong somewhere in that chain, Datadog helps you trace it back to the source instead of digging through disconnected tools one at a time.
That’s the baseline. The real question is what happens when nothing looks wrong at all. When a system fails quietly, without an alert, without an error code, without anyone noticing until a customer does. That’s what this piece gets into.
Monitoring vs. observability: The gap most teams have
Monitoring tells you when a known metric crosses a threshold. Observability lets you ask questions you did not think to ask when you wrote the code.
Most engineering teams already have something. An APM tool, some cloud-native logging, a few dashboards. But Knight Capital also had alerts. The difference is not whether signals exist. It is whether your stack surfaces those signals in a way that demands action at the moment they matter.
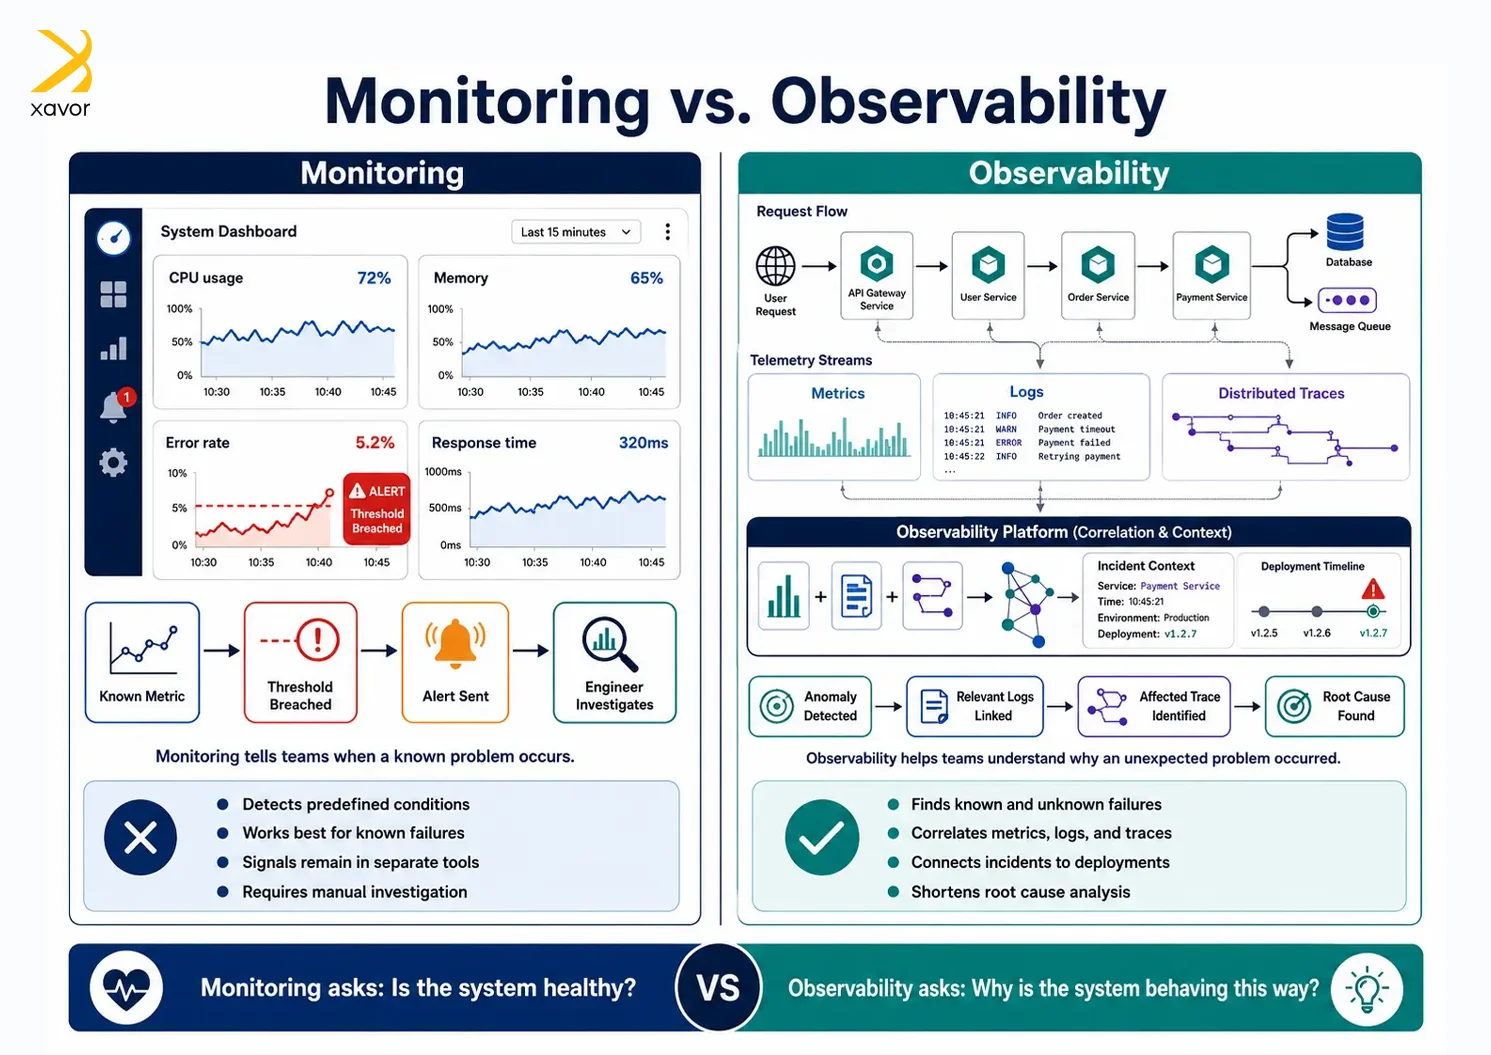
Datadog connects all three observability pillars into one surface. An error rate anomaly links directly to the logs that explain it, which links to the exact trace showing which service call changed after your last deployment and why. No tab switching. No manual correlation. The answer is already in front of you.
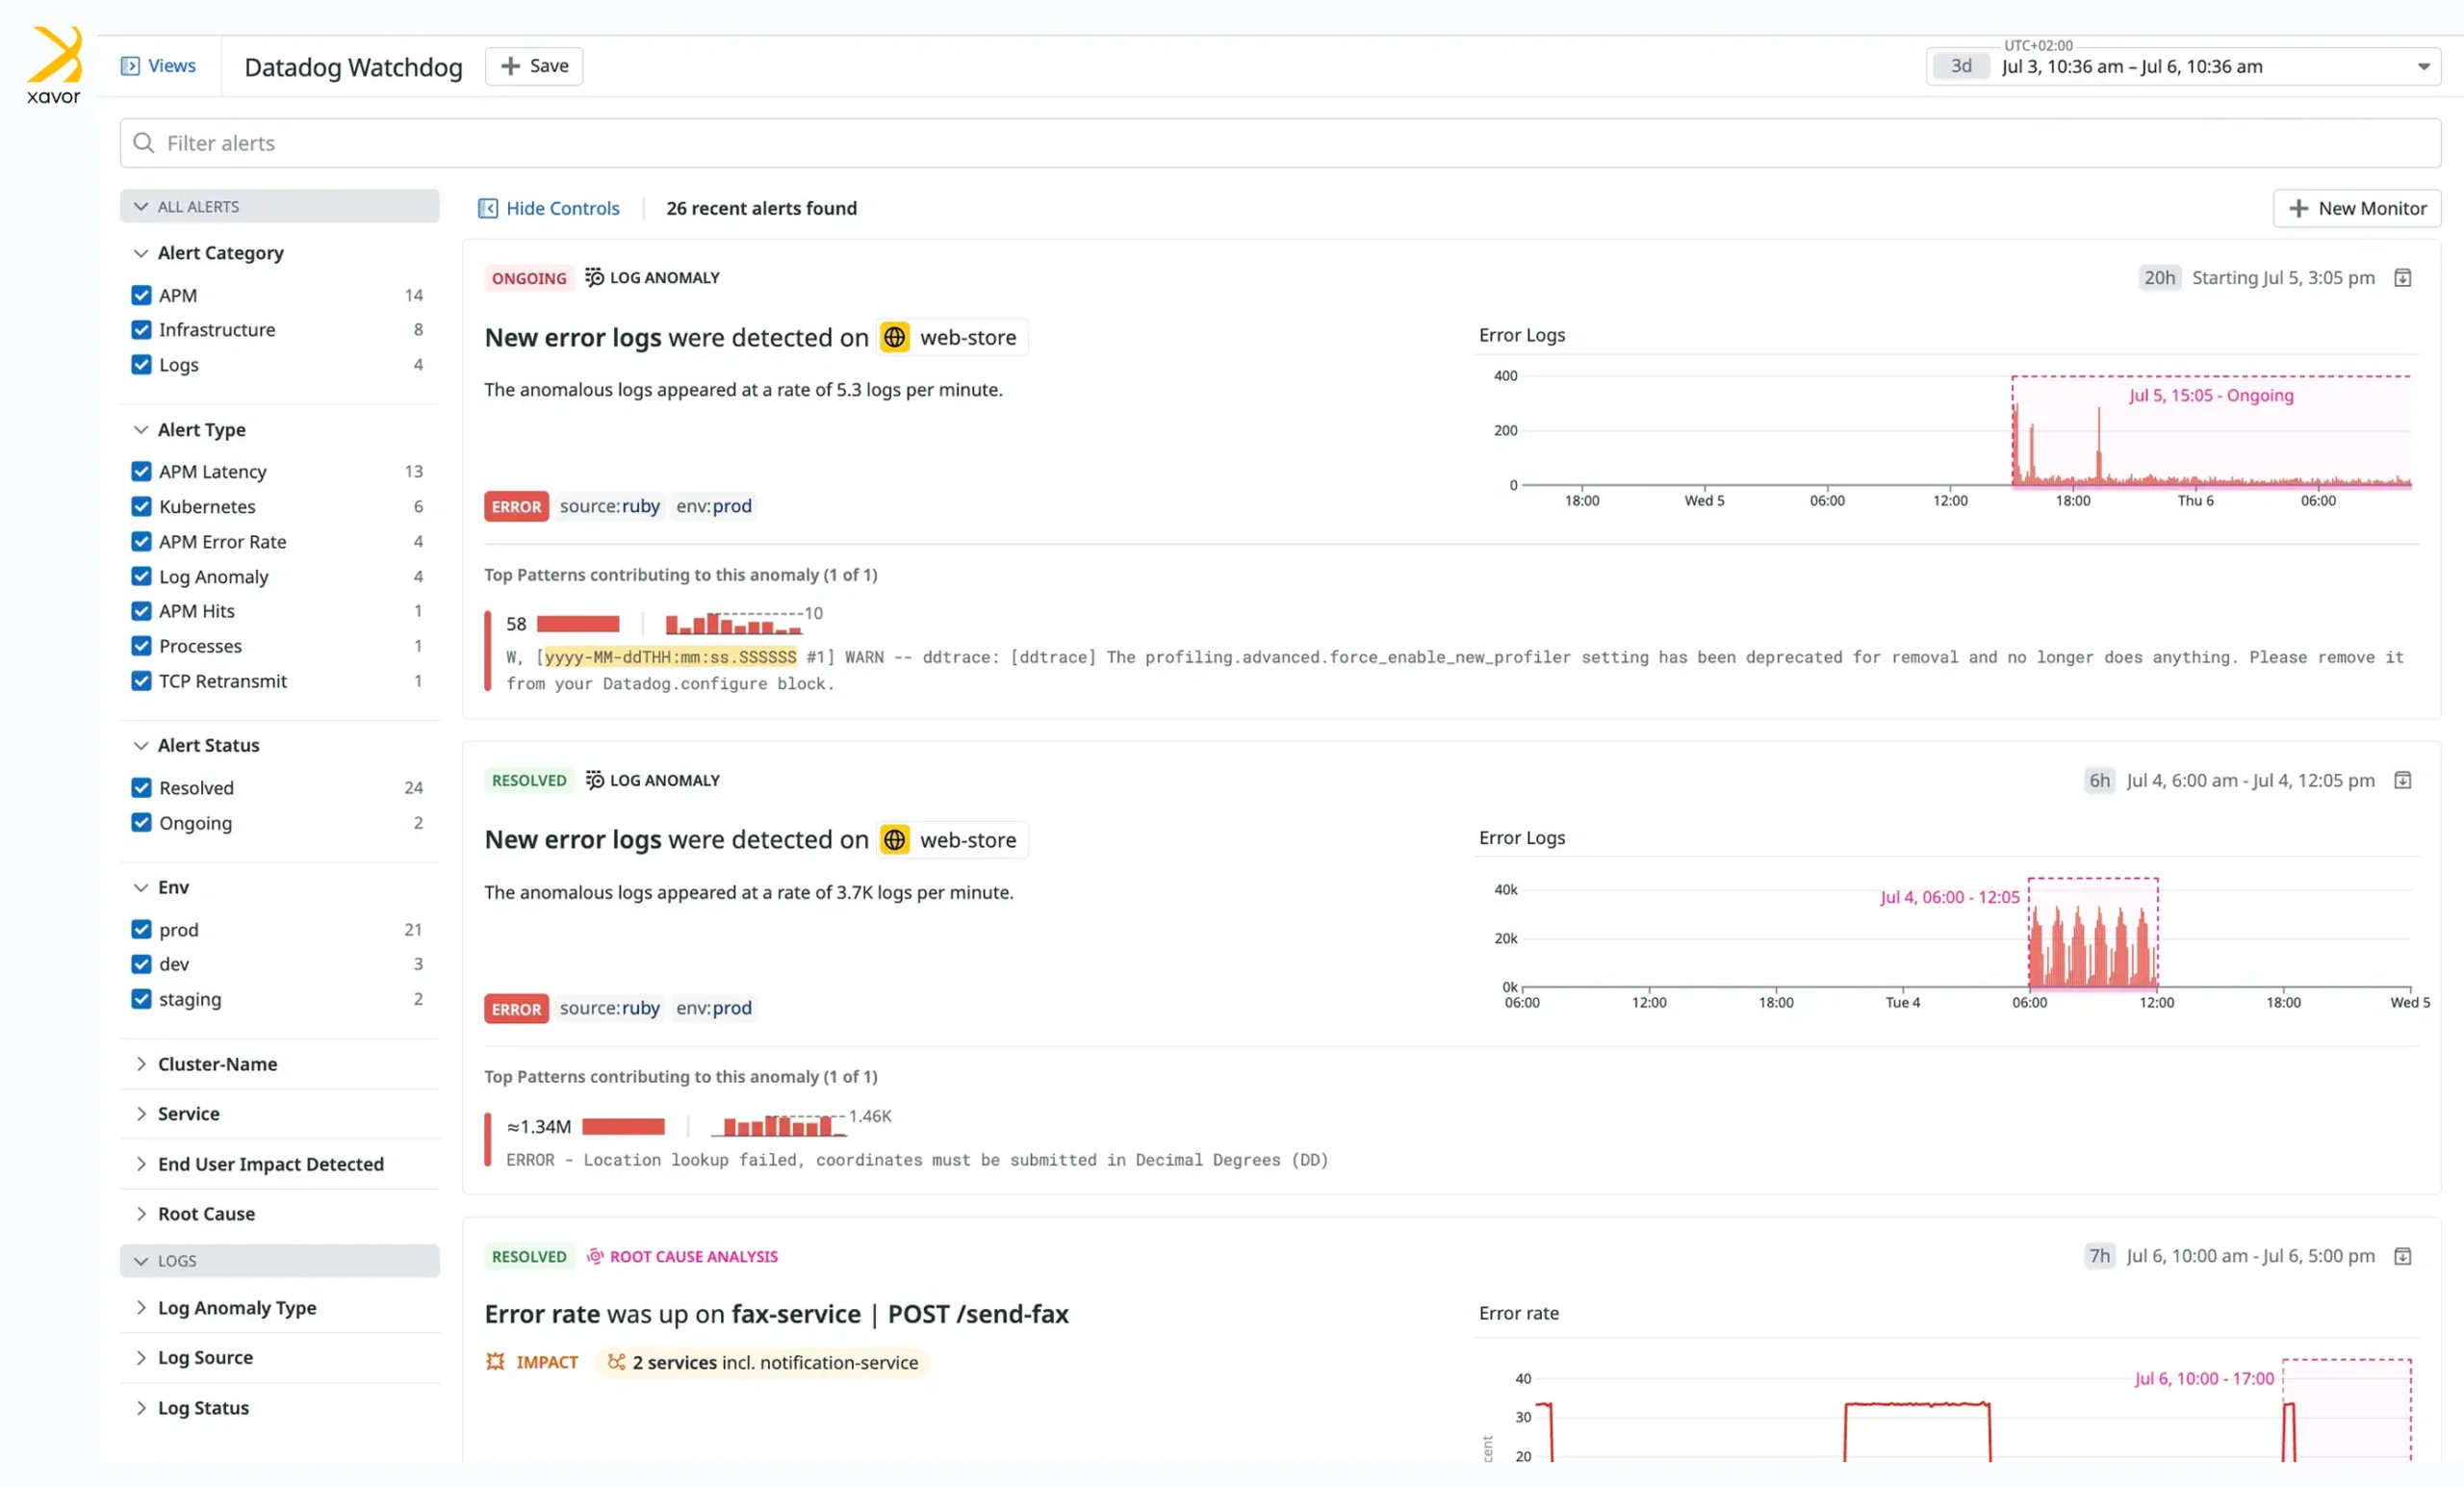
Three silent failure patterns Datadog catches
Deployment regressions that report success. Datadog’s deployment tracking ties every metric and trace to a specific version. The moment a new deployment produces a different error pattern or latency curve compared to the previous version, Watchdog surfaces it automatically before a single user files a complaint.
Slow queries that creep, not spike. A missing index can take a query from 12ms to 900ms over two weeks as data grows. No threshold alert fires during the creep. Database Monitoring surfaces actual execution plans and lock contention so you catch it long before users feel it.
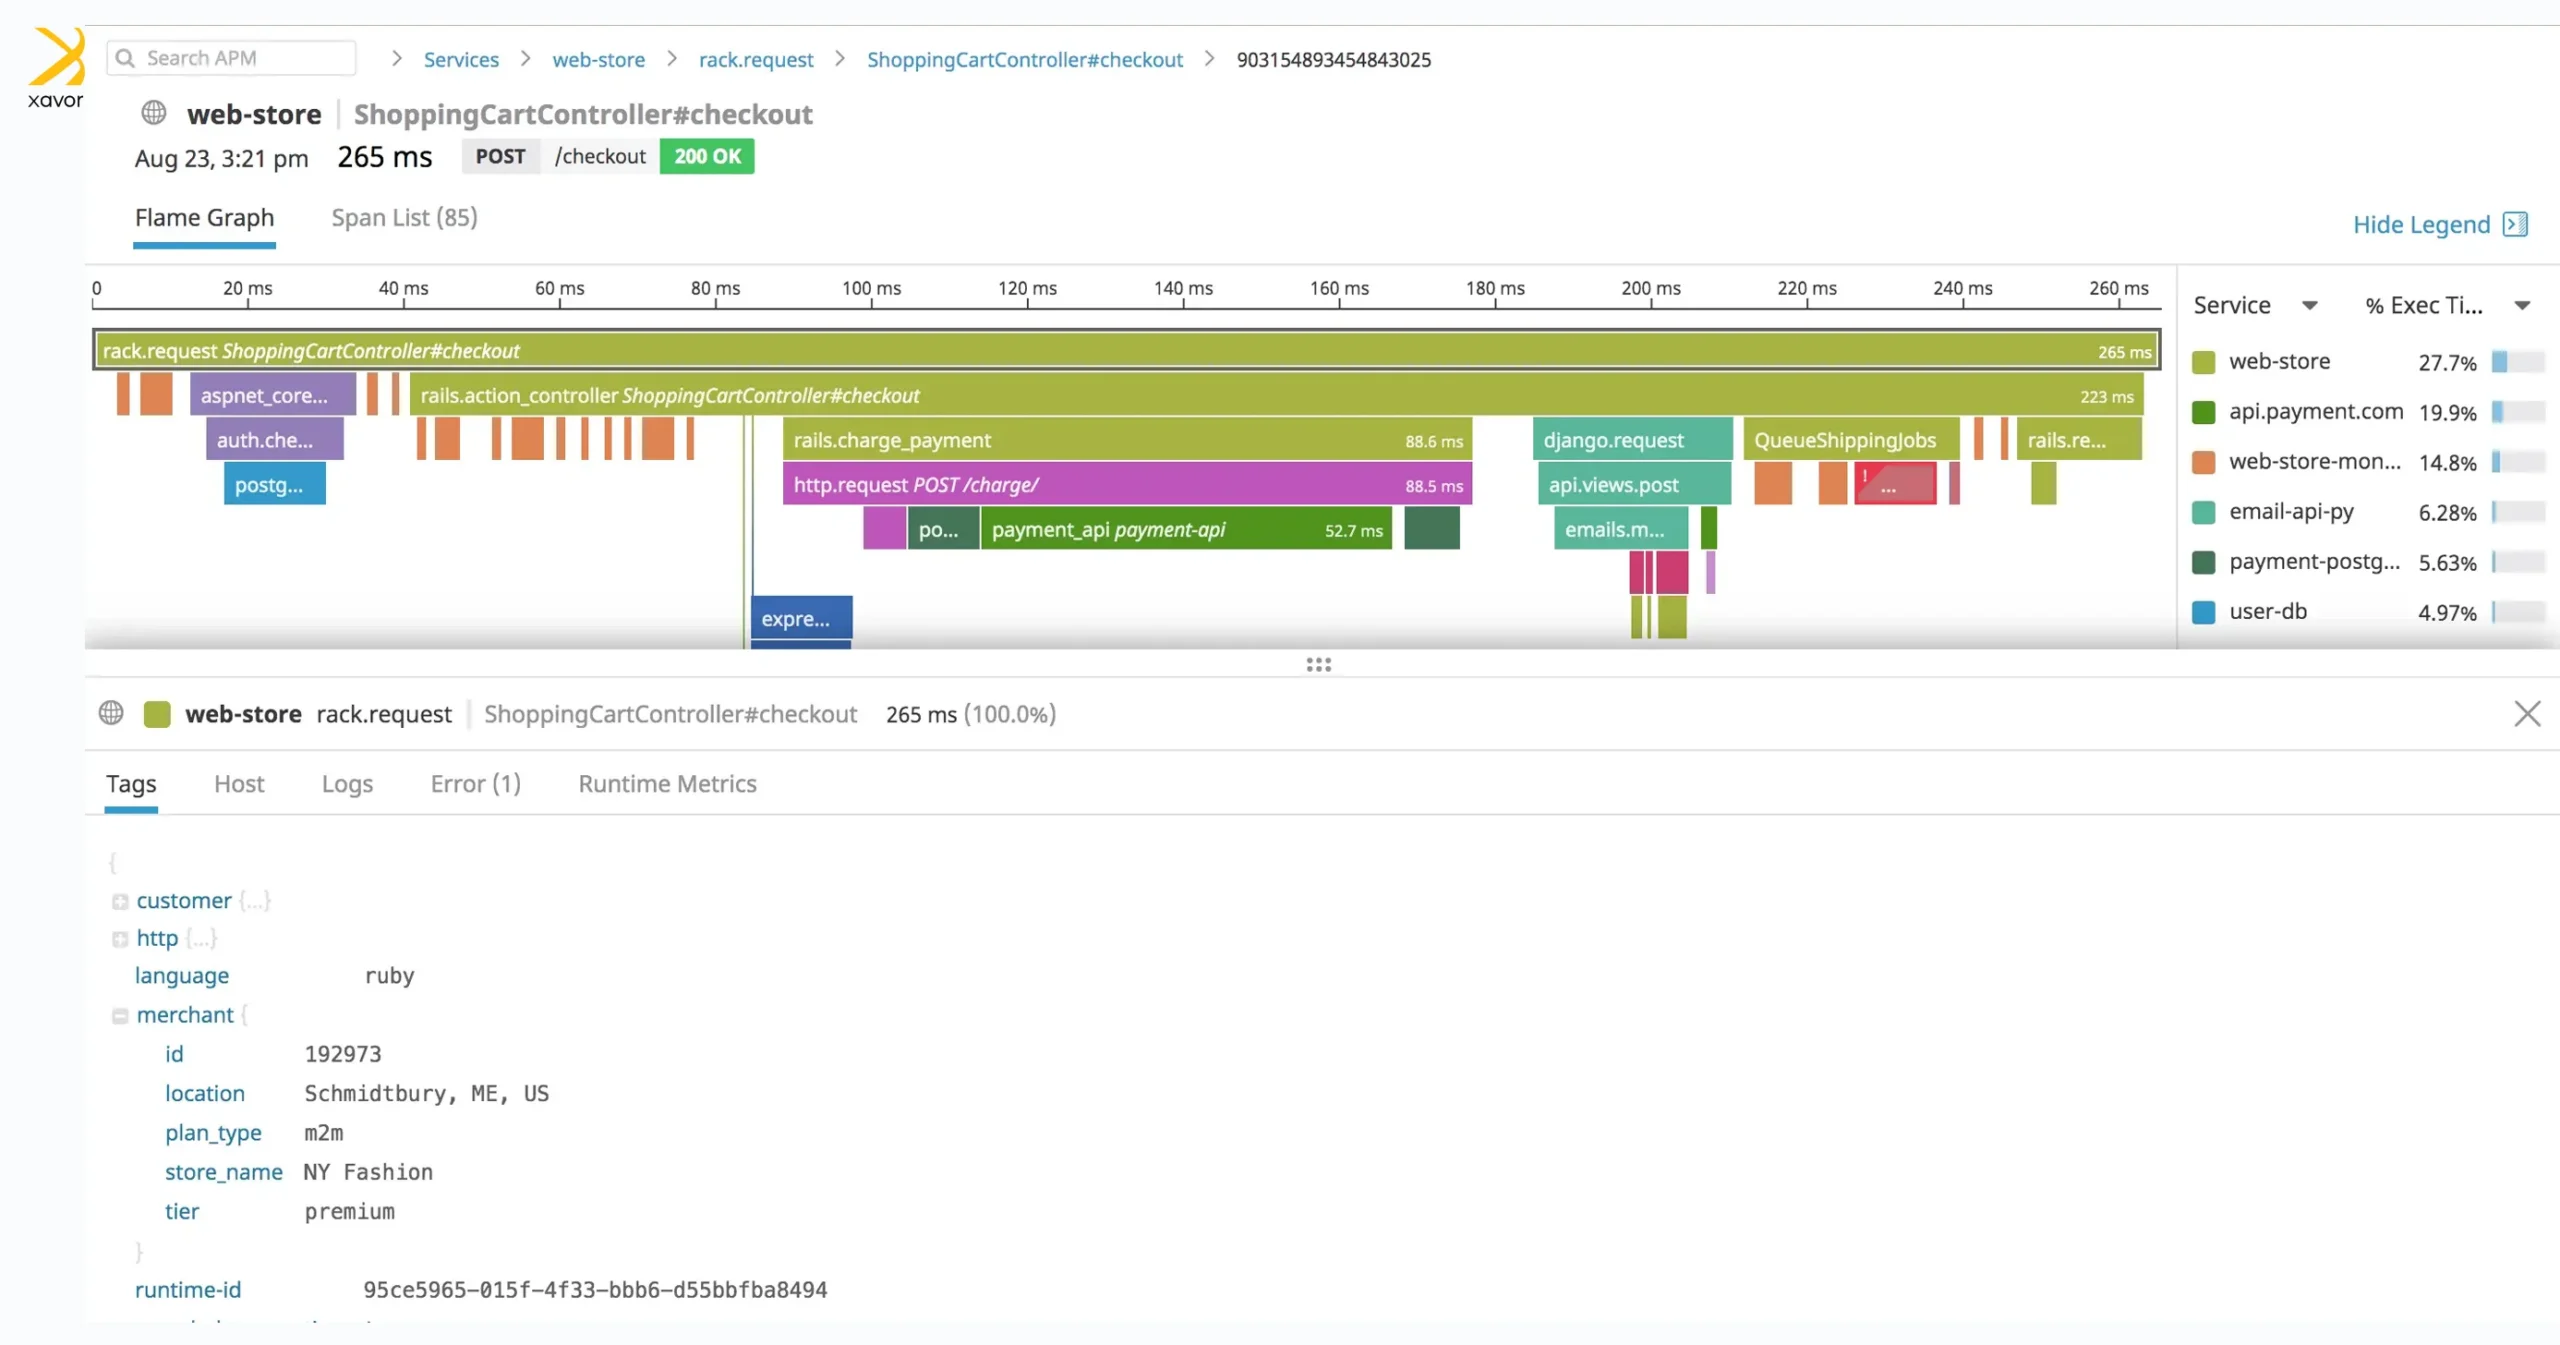
Datadog distributed trace view showing a full request lifecycle with flame graph breakdown. Every span is visible including downstream service calls and individual database queries, with exact timing at each layer.
97 alerts fired and nobody saw them? Here’s how to fix that
The most instructive part of the Knight Capital story is not the $460 million loss. It is the 97 emails. The signals existed. The system was telling the team something was wrong before the market opened. The failure was not in detection. It was in surfacing those signals in a way that demanded action.
This matters beyond alert routing. When infrastructure events affect cloud-native monitoring tools, teams find their visibility degrading at exactly the same moment the systems they are watching start failing. Datadog runs as an independent SaaS layer with its own global intake, decoupled from any single cloud provider’s service health. Your dashboards keep reporting accurately regardless of what is happening at the infrastructure layer.
What catching a silent failure actually looks like
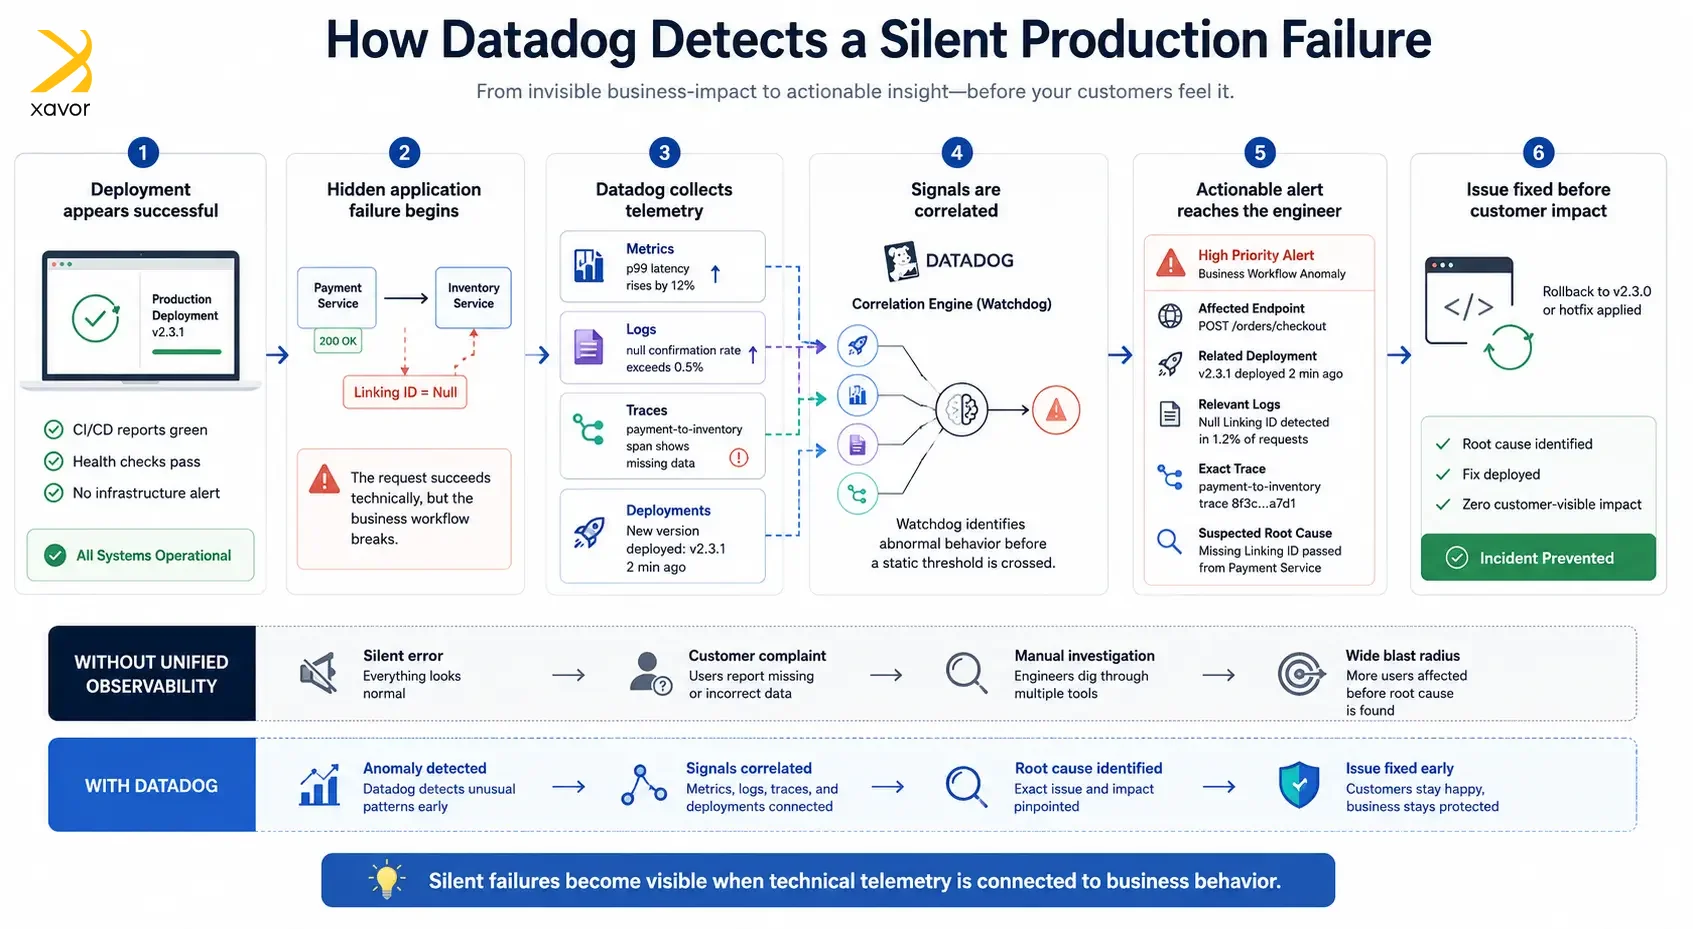
| T+00 | Deployment completes. Health checks pass. CI/CD reports green. |
| T+03 | Watchdog flags a 12% p99 latency increase on the payment endpoint. No threshold crossed yet. The signal is already visible. |
| T+07 | Log-based monitor fires: payment confirmation null rate exceeds 0.5% of transactions. PagerDuty alert sent to on-call engineer. |
| T+09 | Engineer opens Datadog. Three affected requests visible. The payment saves successfully with no errors. But the inventory sync running right after receives an incomplete record and the linking ID is missing entirely. |
| T+18 | Root cause found. A small code change in the deployment broke how payment records connect to inventory. Fix deployed. Incident closed. Zero customer-visible impact. |
Without this stack, the same failure surfaces days later as a business complaint. The blast radius is wide. Remediation takes days. The story starts to look a lot like August 1, 2012, just slower and quieter.
The AI code generation factor
Teams shipping 4x more code also ship 4x more surface area for things to go quietly wrong. AI-generated code is confident. It compiles. It passes tests. But it makes assumptions about null safety, downstream contracts, and edge cases that a developer deeply familiar with the codebase might not.
The Knight Capital deployment script that silently skipped a server was written by one engineer for convenience. Nobody reviewed it as software. In 2026, the equivalent is an AI-generated migration script or configuration file that looks correct, passes review, and activates old behavior in one environment nobody thought to check.
Datadog’s deployment tracking means every version has a paper trail in your metrics and traces. Anomalous behavior gets correlated to a deployment automatically. You roll back with evidence, not instinct. Combined with Feature Flags in Production, deployment tracking gives teams both visibility and control when AI-generated changes behave unexpectedly.
How does Datadog compares vs alternatives
Why not just build this on Prometheus and Grafana? Well, plenty of engineering organizations do. One of our clients uses Prometheus for metrics and Grafana for dashboards. It works, and it’s free, in the way a lot of free infrastructure is free.
But someone still pays, just in engineering hours instead of a subscription.
The gap eventually shows up at correlation. Prometheus tells you a metric moved and Grafana lets you look at it. But neither one hands you the trace or the log line that explains why, automatically, without a human stitching three tools together at 2 a.m.
Datadog’s pitch is that the stitching is already done. New Relic makes a similar one. The real question isn’t which platform has more features. It’s which one gets an engineer from anomaly to root cause the fastest, at 2 a.m., half awake, before the blast radius grows.
Conclusion
The highest-leverage starting point is APM with distributed tracing, log correlation, and one Watchdog anomaly monitor on your primary API surface. That combination catches the majority of silent failures before they become incidents. From there, Database Monitoring, custom business-logic metrics, and synthetic monitors fill in the rest of the picture.
Knight Capital had 97 alerts and no observability. The goal is the opposite: fewer alerts, all of them actionable, and a system where your team finds the failure before your users do.
Are you also running production systems that cannot afford silent failures? Xavor helps engineering teams implement observability that actually works.
Drop us a line at [email protected] to get in touch with our data engineers.

FAQs
Datadog can be worth the investment for teams that need unified observability with minimal operational overhead. Unlike separate tools for metrics, logs, and traces, Datadog automatically correlates telemetry to help engineers identify root causes faster.
Yes. Datadog can detect many silent failures by combining distributed tracing, log analysis, custom business metrics, and AI-powered anomaly detection. This helps uncover issues that traditional infrastructure monitoring may miss.
Prometheus and Grafana provide powerful monitoring and visualization but often require additional tooling and manual correlation. Datadog offers an integrated platform where metrics, logs, traces, and alerts work together out of the box.