

Data observability monitors pipelines on five signals so a failure is caught before the consuming system acts on it. We build and monitor these pipelines at Xavor Corporation in Irvine, California through our BI and data analytics services. Five signals carry the category: freshness, volume, schema, distribution, and lineage. A dashboard fed bad data fails visibly, and a model fed bad data fails plausibly. Data quality checks rules you wrote, and observability surfaces the problems you did not predict.
A broken dashboard is visibly broken, and a model fed bad data returns a plausible answer nobody questions.
What data observability monitors
Five signals carry the category: freshness, volume, schema, distribution, and lineage, in that order. Databricks organizes its own framework around the same five.. Each one detects a different kind of break, and each has a failure that goes unnoticed without it.
| Signal | Catches | Goes unmonitored |
| Freshness | Late or missing arrival | Yesterday’s answer, delivered today |
| Volume | Row counts outside range | A partial load nobody notices |
| Schema | Added, dropped, retyped columns | A join that silently returns less |
| Distribution | Values shifting inside range | The one that reaches a model intact and wrong |
| Lineage | What depends on what | An incident scoped by guesswork |
- Freshness tracks when a table last updated against when it should have.
- Volume compares row counts to expected historical ranges.
- Schema detects structural changes in columns and types.
- Distribution measures whether values inside the data look normal.
- Lineage traces upstream and downstream to show who is affected when something breaks.
Every signal has a failure mode that stays invisible until something downstream acts on it.
Vendors extend the set. Acceldata publishes six pillars, DQLabs seven, and Monte Carlo’s own list names quality where the settled version names distribution. The five above are the version the category converged on.
Building pipelines that hold up is separate work, and we cover how to build ETL pipelines that hold up there.
Why a model fails differently from a dashboard
A dashboard fed bad data fails visibly, and a model fed bad data fails plausibly. The dashboard shows a blank panel or a spike somebody questions. The model returns a sentence shaped like a correct answer.
That difference changes who detects the failure. A dashboard has an audience watching it, and the audience reports what looks wrong.
A model’s output has no comparison point. The user asked a question once and received one answer, with no second version to check it against.
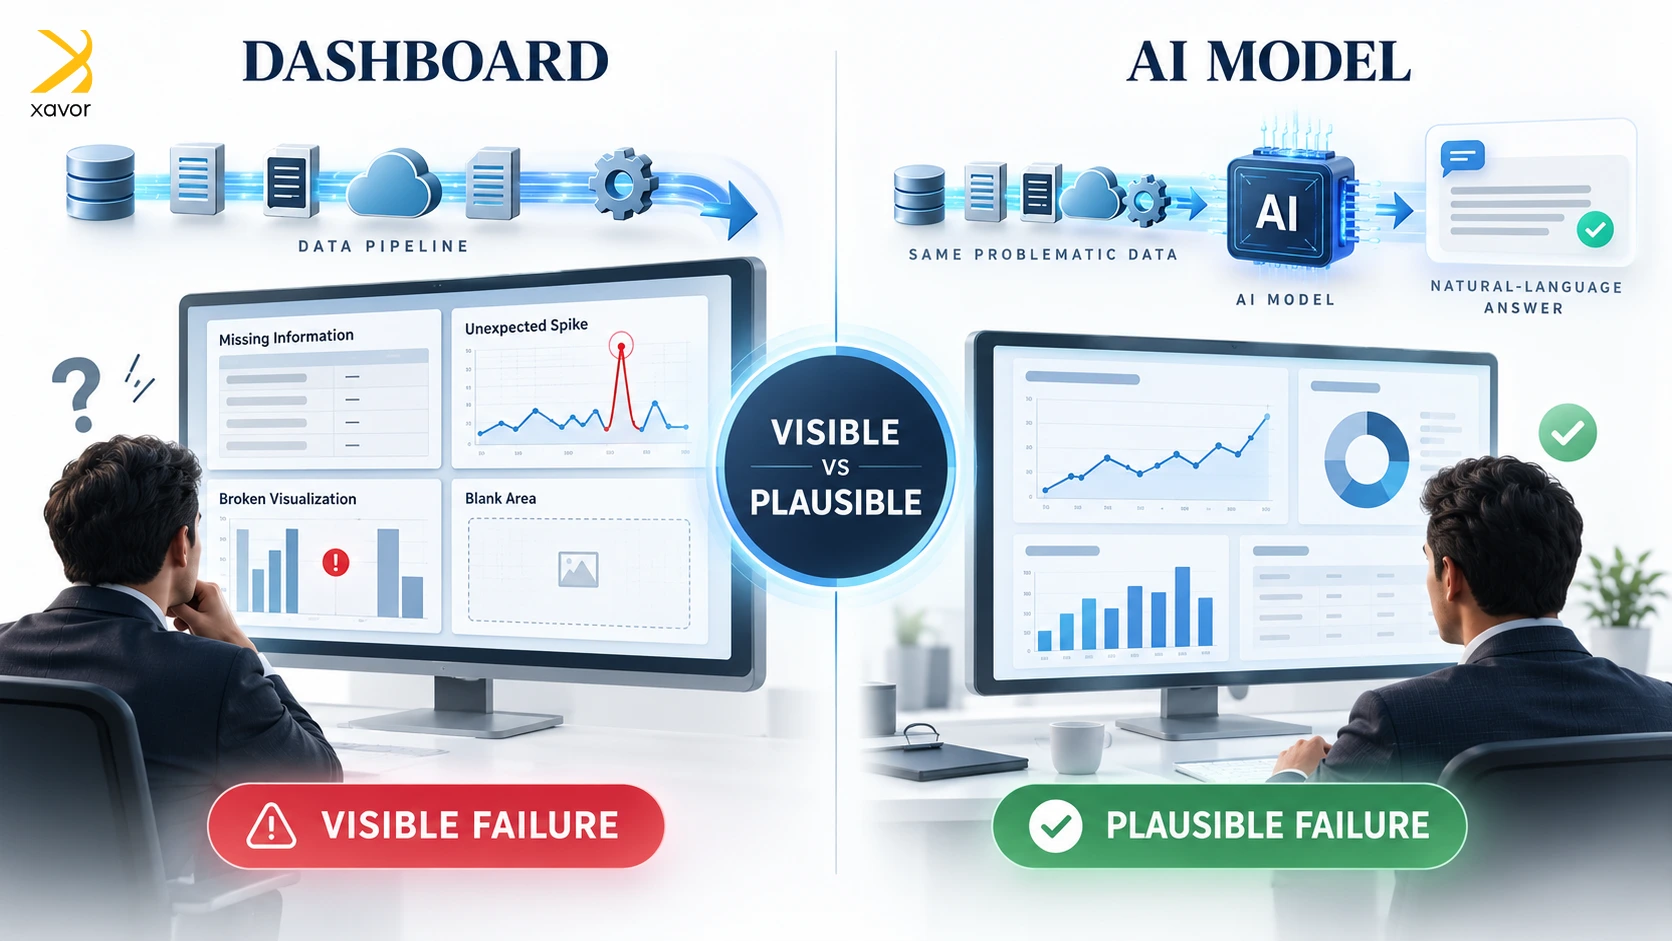
Time to detection is the metric that changes, since nothing downstream of a model will flag a wrong answer.
Published guidance treats the two as equivalent. A common framing describes observability as catching bad data before it reaches dashboards, analytics, or AI models, listing three consumers with one treatment.
They do not fail the same way. A dashboard degrades toward obviously broken. A model degrades toward confidently wrong, which is harder to notice and more expensive to unwind.
Which signals matter most when a model consumes the data
The five signals do not carry equal weight, and the ranking changes with what reads the data. Freshness and schema break both consumers loudly. Volume shows up in a chart and rarely in a model output. Distribution inverts entirely.
| Signal | Dashboard | Model | Why |
| Freshness | High | High | Both break on stale data |
| Volume | High | Medium | A partial load shows in a chart |
| Schema | High | High | Breaks both, and breaks loudly |
| Distribution | Low | Highest | Barely moves a chart, moves a model |
| Lineage | Medium | High | Blast radius spans more systems |
Distribution is the lowest-priority signal when a dashboard reads the data and the highest when a model does.
Distribution, the signal that changes rank
A three percent shift in a feature distribution is invisible on a chart. The bars move slightly. Nobody files a ticket.
The same shift changes what a model weighs. A field that skewed one way during training and skews another way in production produces different outputs from identical logic.
Detecting that needs a baseline, not a threshold. The question is not whether values fall inside a valid range. It is whether the shape of the values changed.
We documented that approach in a governed Snowflake Cortex platform serving AI agents, where the data feeds agents rather than reports.
Where the two monitoring worlds stop talking
Machine learning teams monitor the same problem under a different name, in a separate literature. They call it data drift, and they measure it with statistical distance tests.
The two communities barely reference each other. Search data observability and you find data platform and observability vendors. Search data drift monitoring and you find machine learning tooling instead.
Same failure, two vocabularies, two sets of tools. A pipeline feeding a model sits between them.
Data observability vs data quality: where the two diverge
Data quality checks rules you wrote, and data observability surfaces the problems you did not predict. Quality is prescriptive and asks whether values meet defined standards. Observability is descriptive and asks whether the system is behaving as it normally does.
| Data quality | Data observability | |
| Asks | Is this data correct? | Is this system behaving normally? |
| Method | Rules you defined | Baselines it learned |
| Catches | Problems you predicted | Problems you did not |
| Scope | Specific datasets | Source to consumption |
| Produces | Cleansing and correction | Alerts and root cause |
A rule catches a null in a column you knew to watch. A baseline catches a column that arrived full of values nobody expected.
Neither replaces the other, and every source in the category says so.
Teams that run only rules miss the unanticipated. Teams that run only baselines detect anomalies without knowing which ones violate a standard. The practices are covered separately in data quality management for AI agents.
Designing alerts people act on
An alert nobody acts on trains everybody to ignore alerts, including the one that mattered. Coverage is the easy part of data pipeline monitoring. Tuning is where most programs stall.
Three decisions set whether alerts get read:
Thresholds. Static rules are predictable and fire on seasonal traffic. Learned baselines adapt and need enough history to be trustworthy first. Pick static where volumes are stable and learned where they move.
Routing. The design question is who owns which table. Most estates cannot answer it, so alerts land in a shared channel and belong to nobody. Routing to Slack or PagerDuty resolves nothing until ownership exists.
Severity. A distribution shift on a feature a model reads warrants waking someone. The same shift on a sandbox table belongs in a backlog.
Severity has to be a property of the consumer rather than the signal.
That ordering is what keeps volume manageable. Our work on enterprise data engineering in semiconductor manufacturing ran at a scale where untuned alerting would have buried the team within a week.
A production checklist for observable AI pipelines
Five checks separate a monitored pipeline from one that only appears monitored. Run them before a model reads anything in production.
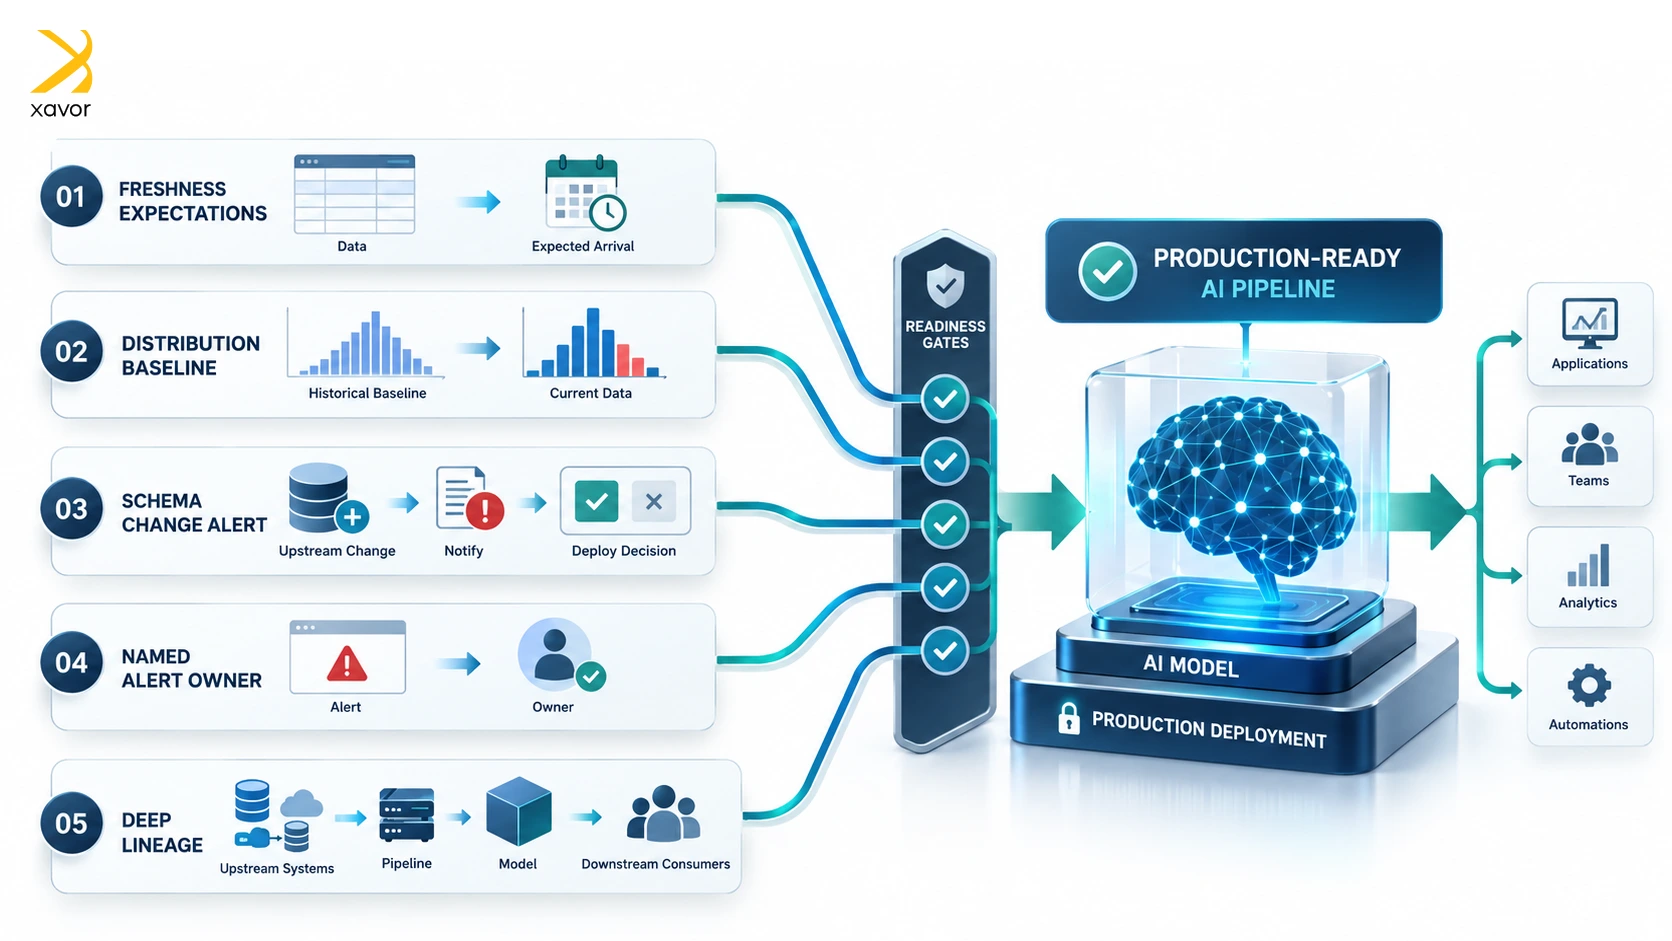
- Freshness expectations exist per table: every table feeding a model has a stated arrival window.
- Distribution baselines predate go-live: a baseline built after launch describes the problem rather than catching it.
- Schema changes reach a person first: upstream teams signal structural changes before they ship.
- Every alert has a named owner: an alert routed to a channel is routed to nobody.
- Lineage covers enough depth to scope an incident: tracing one hop upstream is rarely enough.
Coverage without an owner is a dashboard, and a dashboard nobody opens is not monitoring.
Databricks publishes a data observability framework built on the same five signals, which makes the vocabulary portable across platforms. Coverage still needs deciding per table.

FAQs
Data observability is continuous monitoring of data systems and pipelines across five signals: freshness, volume, schema, distribution, and lineage. It differs from traditional monitoring by examining the condition of the data rather than reporting that a system crashed.
Freshness, volume, schema, distribution, and lineage. Freshness tracks arrival timing, volume tracks row counts, schema tracks structural changes, distribution tracks statistical shape, and lineage traces what depends on what.
Data quality checks data against rules you defined, catching problems you anticipated. Data observability monitors signals against learned baselines, surfacing problems you did not. Both are covered further in our data quality management article.