
Agentforce Observability is the Salesforce application for monitoring, analyzing, and optimizing AI agents in production. We build and instrument Agentforce deployments at Xavor Corporation in Irvine, California through our Salesforce development and administration services. Session tracing records every turn, action, and reasoning step an agent takes into Data Cloud. Three surfaces carry agent monitoring: live conversations, aggregate metrics, and individual session traces. And Salesforce made Agentforce Observability unmetered across all Agentforce SKUs.
Tracing costs nothing to turn on now, which removes the reason most teams delayed it.
What Agentforce Observability captures
Session tracing records every turn, action, and reasoning step an agent takes into Data Cloud. Four components carry that recording, and each one holds a different layer of the same interaction.
- Agentforce Session Tracing captures and stores detailed agent interaction data in a unified data model on Data Cloud.
- The Session Tracing Data Model logs actions, prompt inputs, LLM outputs, and error messages.
- Agent Platform Tracing captures every Agentforce action execution as an OpenTelemetry trace tree stored in Data Cloud.
- Agent Analytics uses the Session Tracing Data Model to track every event and turn across sessions.
A trace records what the agent did and the reasoning it followed to get there.
One naming note worth carrying into your own documentation. Salesforce Help now publishes Agent Analytics as the current product, with Legacy Agentforce Analytics retiring from May 2026. Some Salesforce pages still use the older name.
How to monitor Agentforce agents
Three surfaces carry agent monitoring: live conversations, aggregate metrics, and individual session traces. Each answers a different question, and teams that use only one find out late.
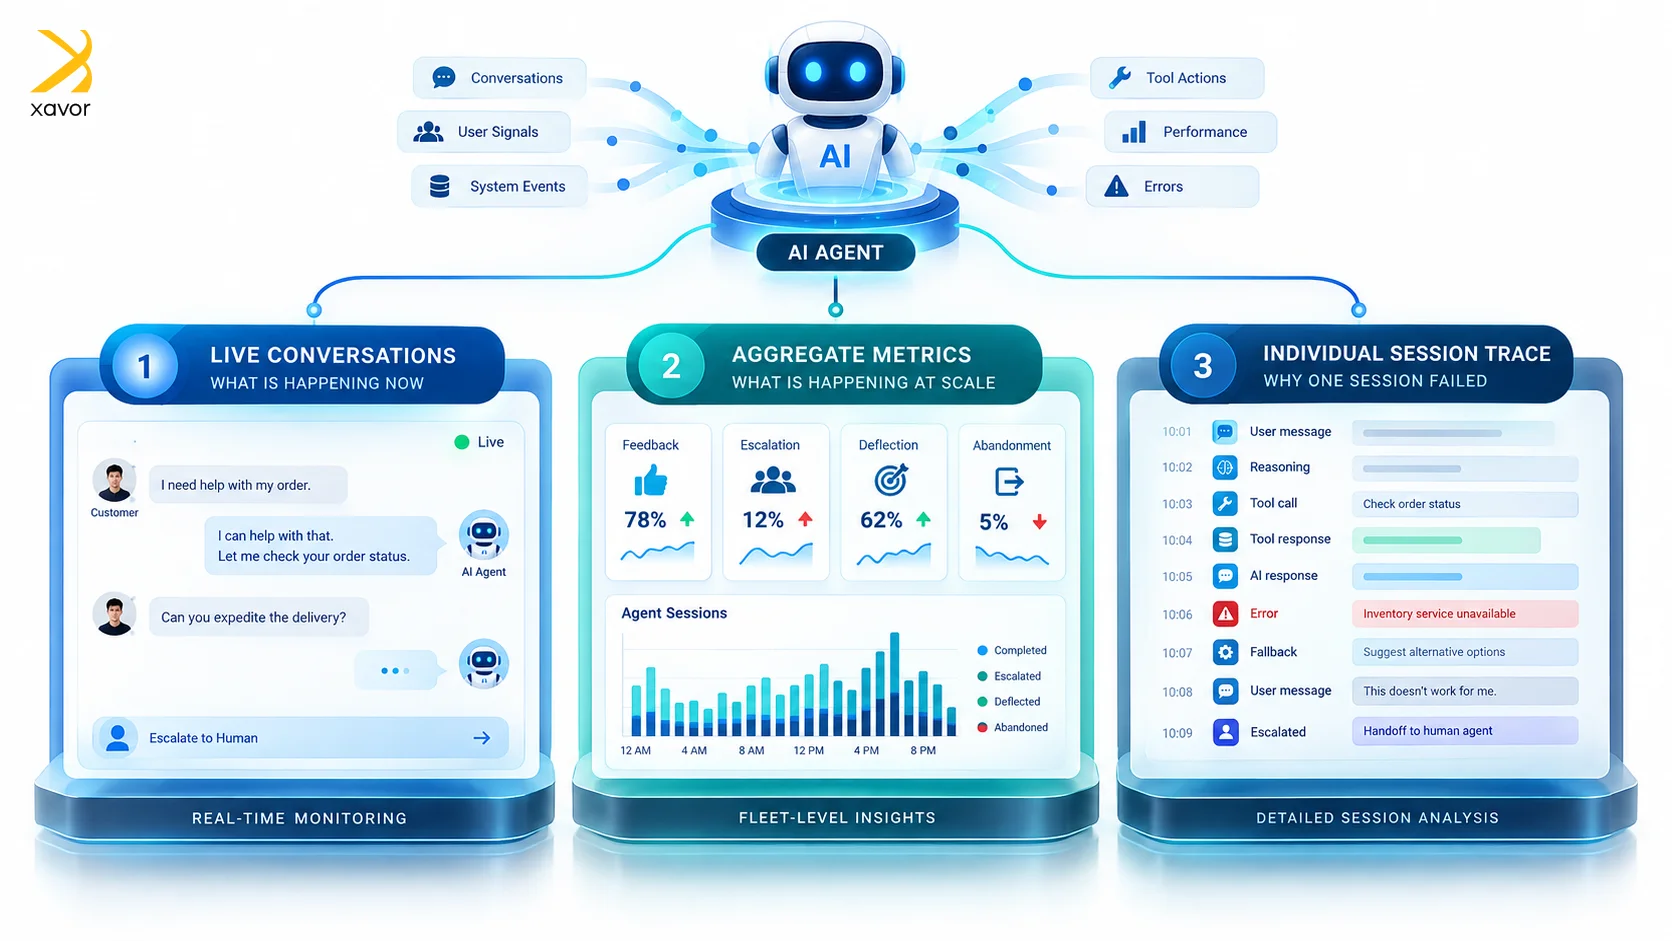
Aggregate metrics tell you something is wrong, and a session trace tells you where.
Watching live conversations
Omni-Supervisor shows active agent conversations as they happen, with escalation built into the view. Open the Omni-Supervisor tab and select the Agents section.
Raised flags appear at the top of the conversation list. Clicking Transfer to Rep moves the customer to a human.
Command Center for Service shows all active conversations, displaying up to 100 at a time.
The four metrics Agent Analytics reports
Agent Analytics measures feedback, escalation, deflection, and abandonment across every session. The dashboards sit inside Agentforce Studio.
| Metric | What it indicates |
| Customer feedback | Whether the outcome satisfied the person |
| Escalation rate | How often the agent hands off |
| Deflection rate | How often it resolves without a human |
| Abandoned sessions | Where people give up mid-conversation |
Agent Analytics also surfaces session outcomes and adoption trends. The work of getting agent data into a queryable state sits in the Data 360 implementation work behind agent analytics.
Reading a single session trace
Clicking a response inside a trace shows the reasoning and the path the model followed. That makes a trace closer to a debugger than a report.
Sessions and intents carry quality scores against each customer intent. A low score on one intent isolates the problem faster than a falling aggregate.
Traces exist to isolate failure points, which is a different job from measuring performance.
What Agentforce Observability costs now
Salesforce made Agentforce Observability unmetered across all Agentforce SKUs, and the boundary is published precisely. The change covers session tracing, telemetry data ingestion, the metrics and aggregations powering dashboards, and out-of-the-box dashboard queries. Usage still appears in Digital Wallet.
| Unmetered | Still metered |
| Session tracing and telemetry ingestion | Building new dashboards |
| Metrics and aggregations | Ingesting external data sources |
| Out-of-box dashboard queries | Creating new semantic model objects |
| Modifying existing dashboards | — |
What remains metered is net-new customization rather than monitoring itself.
Salesforce states observability is unmetered for every customer, and every drill-down, alert evaluation, and session trace now runs at no additional Data Cloud cost.
The contrast is worth holding. Agent actions still consume Flex Credits, which Salesforce publishes at $500 per 100,000, with a standard action drawing 20 credits at ten cents. Watching those actions no longer costs anything.
One consequence follows directly. Teams that previously limited dashboard access to one or two people can now open it to every builder and stakeholder.
The wider return calculation sits in how Agentforce delivers return on AI investment.
How multi-agent session tracing works
A single session can route through several specialist agents, and the trace records each handoff. Sub-agent routing appears in the session flow alongside the turns and actions.
Multi-agent traces are included free for every Agentforce customer. Salesforce describes them as isolating issues related to ineffective subagents and actions.
A failed handoff between two agents looks identical to a single agent failing until the trace separates them.
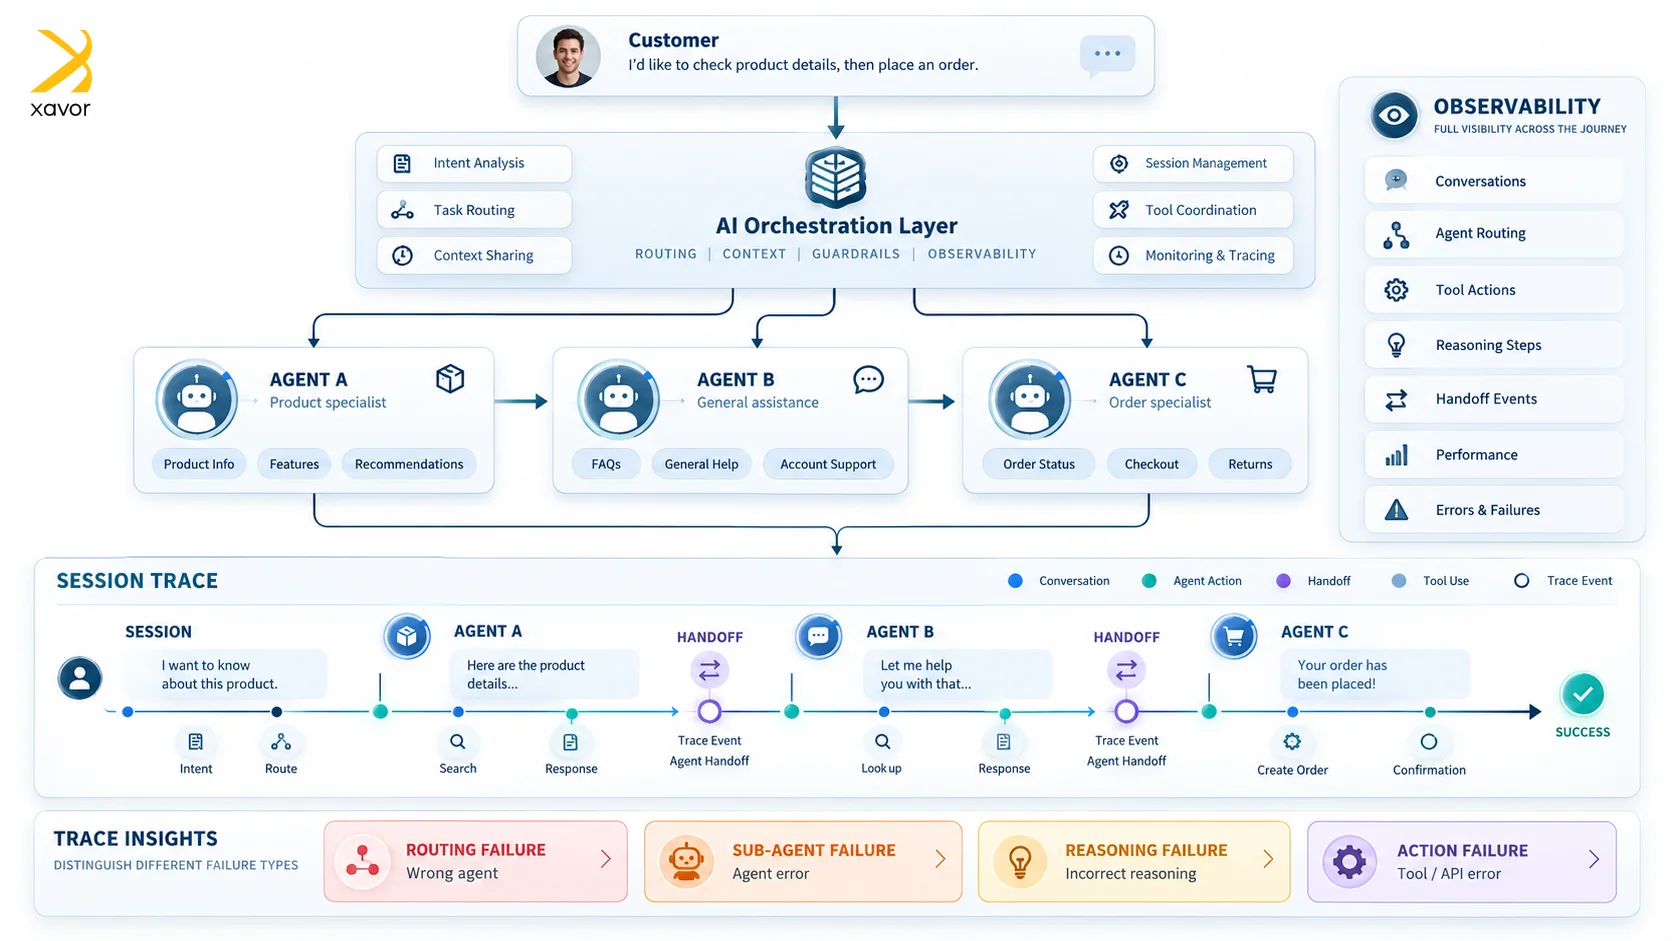
We built a multi-agent Salesforce deployment with specialist agents and orchestrated handoffs for a specialty retailer. Three specialists handled product discovery, general assistance, and order queries.
The orchestration layer transitions between them when a customer pivots mid-conversation, from a recommendation request to a shipping status query, without losing the thread. Reading that transition in a trace is how you tell a routing problem from a reasoning problem.
Where session tracing stops
Three documented limits shape how a team operationalizes tracing, and each surprises people late. None appears in most published guidance.
- Draft and inactive agents produce nothing: only active agent sessions are captured.
- The export API is beta: the Session Trace OTel API accepts one session ID per request, supports no bulk query, and returns sessions started within the previous 72 hours.
- Digital Wallet lags: it reports on a 72-hour delay, while the AI usage data model in Data 360 refreshes every five minutes.
A draft agent produces no traces, so the agent you are testing is invisible.
Two prerequisites sit underneath all of it. Session tracing needs Standard Data Model version 1.130 or higher. And audit logging captures only events after you enable it, with no backfill of what came before.
Turning findings into agent changes
Four patterns appear often enough in session data to point at a specific change each time. Each maps to a metric Agent Analytics already reports.
| What the signal shows | The change it points to |
| High escalation on one intent | A missing action or an ambiguous instruction |
| Abandonment clustering at one turn | The conversation stalls at a specific step |
| Sub-agent routing looping | Topic boundaries overlap between agents |
| Low quality scores on correct answers | The response is right and reads wrong |
The first three are diagnosable from the trace alone. Open a failing session, follow the reasoning, and the gap usually names itself.
A correct answer that scores badly is the failure teams misdiagnose most often.
The fix there is rarely the model. It is tone, length, or an answer that resolves the question without acknowledging what the person asked. Designing that layer is part of Xavor’s agentic AI development services.
A production readiness checklist
Five checks separate an instrumented Agentforce deployment from one that only appears instrumented. Run them before the agent handles volume.
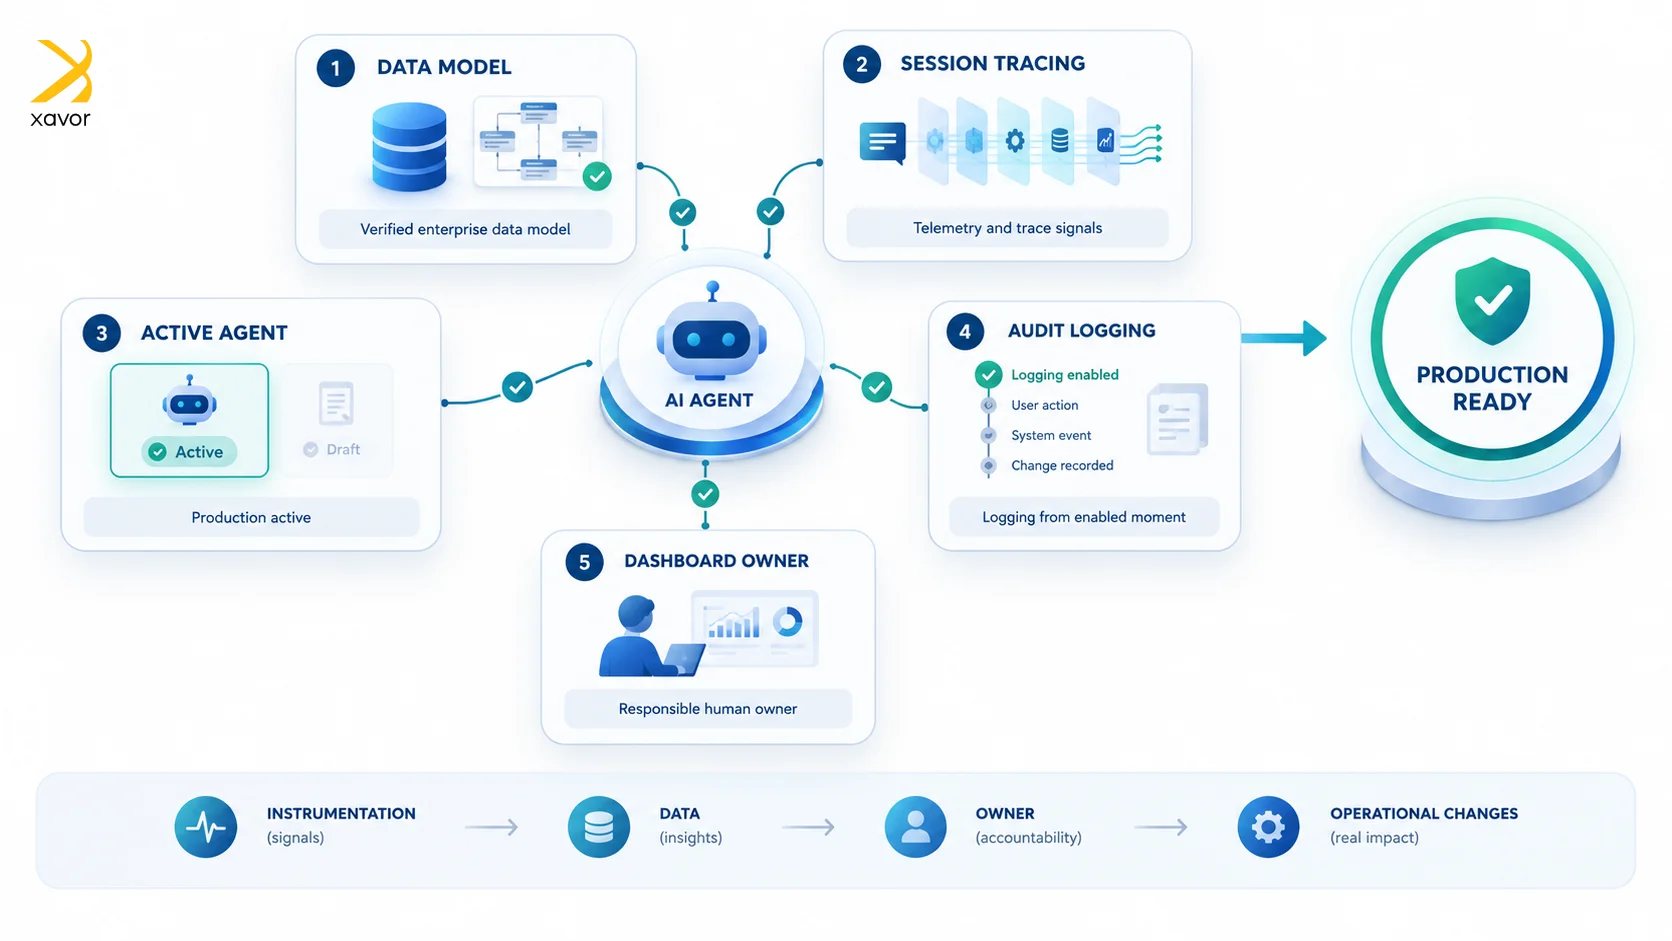
- Standard Data Model 1.130 or higher installed: session tracing depends on it.
- Session Tracing enabled: turn it on under Einstein Audit, Analytics, and Monitoring Setup.
- Agents active rather than draft: a draft agent generates no trace data.
- Audit logging enabled early: historical usage is not backfilled once you switch it on.
- A named owner for the dashboards: access is no longer cost-limited, so the constraint is attention.
Audit logging captures only what happens after you turn it on, which makes the enable date a data boundary.
Teams extending the interface alongside instrumentation will find the API surface covered in extending Agentforce with custom UI and APIs.
Instrument before you scale
The cost argument for delaying instrumentation no longer holds, which leaves only the work.
Turning tracing on takes a setup toggle and a data model version check. Reading what it produces, and converting that into agent changes, is a standing practice rather than a project.
Tracing costs nothing to turn on now, which removes the reason most teams delayed it. Turning what it records into agent changes is the part that takes work. If you want that scoped against agents you already run, [email protected] reaches our Salesforce team.

FAQs
Agentforce Observability is the Salesforce application for monitoring, analyzing, and optimizing AI agents. It combines session tracing, Agent Analytics dashboards, and live conversation monitoring, with trace data stored in Data Cloud.
Use three surfaces. Omni-Supervisor shows live conversations with escalation flags. Agent Analytics in Agentforce Studio reports aggregate metrics. Individual session traces show the reasoning and path behind any single response.
Yes. Sub-agent routing is recorded in the session flow, so a trace shows which specialist agent handled each part of a conversation. Multi-agent traces are included free for every Agentforce customer.