

Business intelligence has traditionally helped organizations understand past performance through dashboards and reports. However, businesses increasingly need to anticipate future outcomes and make informed decisions. Predictive business intelligence uses historical data, statistical models, and machine learning to forecast demand, identify risks, and support planning. With business intelligence and data analytics services, organizations can connect existing reporting capabilities with advanced analytics to improve decision-making.
What are the limitations of traditional business intelligence reporting?
Traditional business intelligence reporting primarily analyzes historical and current business data. It helps organizations measure performance through key performance indicators (KPIs), identify trends, and investigate changes across departments. However, historical reporting has limited ability to estimate future outcomes or assess how different business decisions might affect performance.
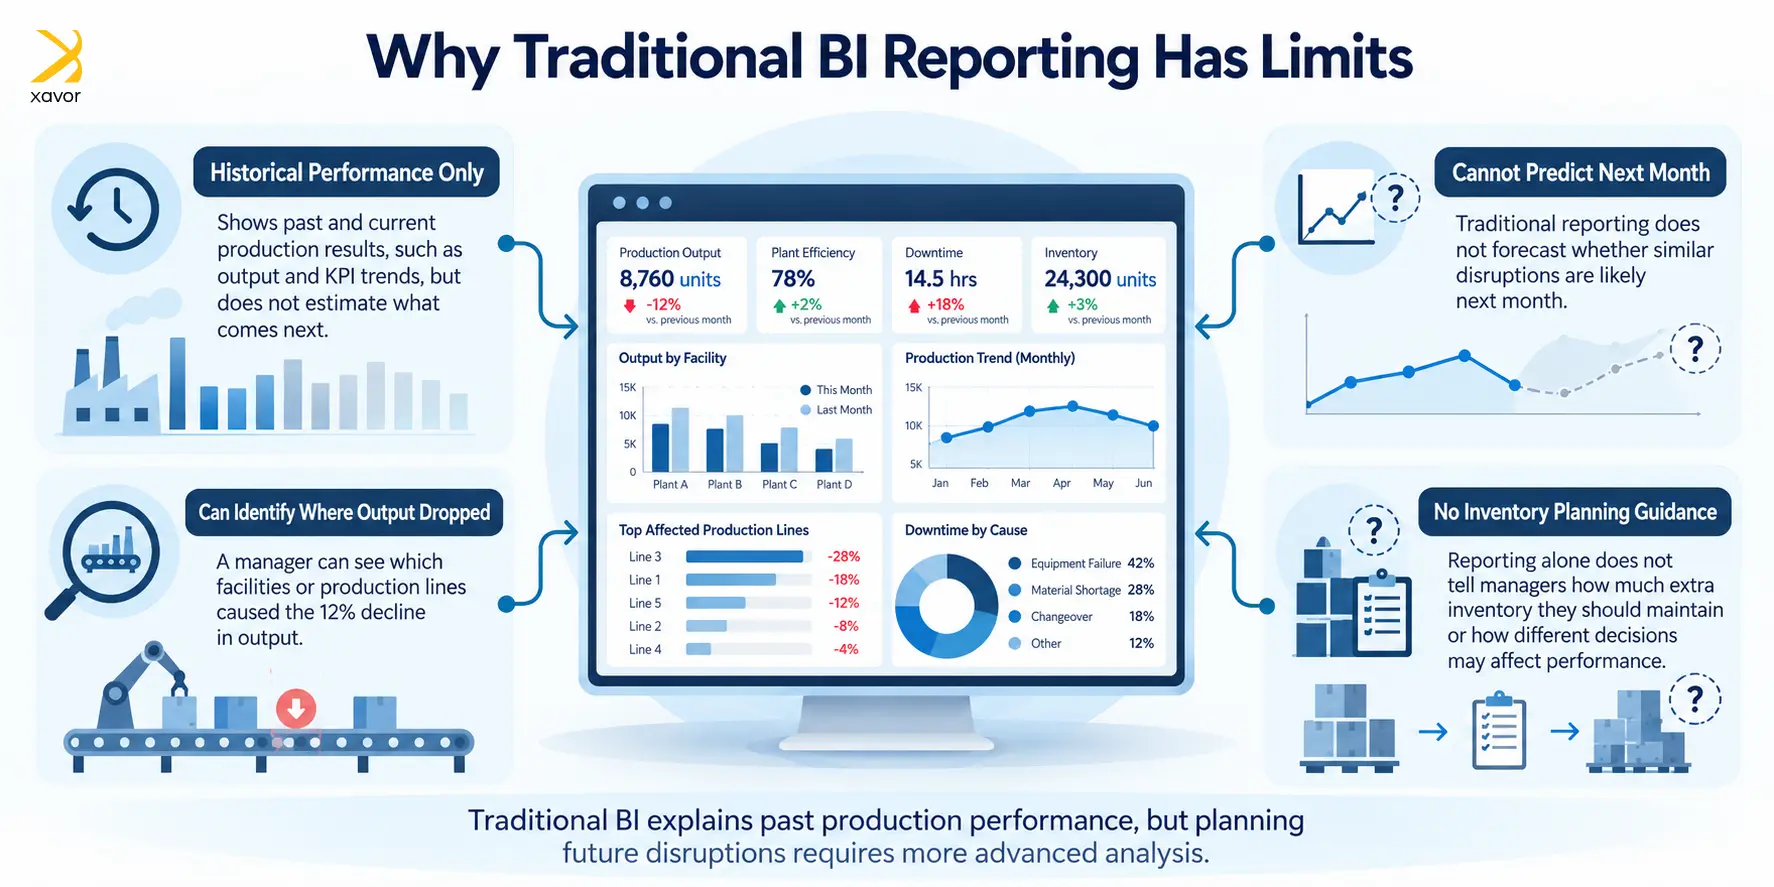
Consider a manufacturing company reviewing its monthly production dashboard.
The report shows that production output decreased by 12% compared with the previous month. A manager can investigate which facilities experienced the largest decline and identify the production lines responsible.
However, the manager may still need to determine whether similar disruptions are likely next month or how much additional inventory the company should maintain.
These questions require more advanced analytical methods.
Traditional BI remains useful because businesses need accurate historical information to evaluate performance. The challenge arises when organizations expect reporting tools to answer questions that require forecasting or statistical analysis.
How has business intelligence analytics developed over time?
Business intelligence analytics includes several methods that address different business questions. These methods are commonly grouped into descriptive, diagnostic, predictive, and prescriptive analytics. Each provides a different level of analysis, and organizations frequently use them together within the same reporting environment.
| Analytics type | Main question | Common techniques | Business example |
| Descriptive | What happened? | Dashboards, KPI reports, trend analysis | Reviewing monthly revenue |
| Diagnostic | Why did it happen? | Drill-downs, segmentation, variance analysis | Investigating declining sales |
| Predictive | What is likely to happen? | Statistical forecasting, machine learning | Estimating next quarter’s demand |
| Prescriptive | What should we consider doing? | Optimization, simulation, scenario analysis | Evaluating inventory allocation options |
Descriptive and diagnostic analytics
Descriptive analytics establishes a historical view of business performance. For example, a retail company may track revenue by product category, store location, or customer segment.
Diagnostic analytics examines the factors associated with those results.
Suppose sales decline in a particular region. An analyst can compare transaction volumes, customer activity, and product availability to investigate possible causes.
Features such as drill-through reporting and interactive filters make these investigations easier. Xavor’s article on how Power BI manages data complexity explains how report designers can present detailed information without overwhelming business users.
Predictive and prescriptive analytics
Predictive analytics uses patterns in existing data to estimate future results. Common methods include time-series forecasting, regression analysis, and machine learning models.
For example, a manufacturer could combine historical orders with seasonal demand patterns to estimate production requirements.
Prescriptive analytics adds decision analysis. If forecasts suggest an increase in demand, optimization models can evaluate different procurement schedules or production allocations.
According to IBM’s March 2026 explanation of predictive forecasting, forecasting methods use historical information and statistical techniques to support decisions about future business performance.
How does predictive business intelligence work?
Predictive business intelligence combines business data with statistical or machine learning models to estimate future events. Organizations prepare historical records, identify relevant variables, train forecasting models, and evaluate their accuracy. The resulting estimates can then appear in BI dashboards alongside historical performance measures.
Consider a retailer forecasting weekly inventory demand.
First, the company collects historical sales transactions, stock availability, and product information. Analysts may also include promotions or seasonal variations when those factors affect purchasing behavior.
Next, the company prepares the data by correcting inconsistent records and identifying missing values. A forecasting model then examines historical relationships to estimate future demand.
Before deployment, analysts test the model against historical periods that were excluded from training. This process helps determine whether its predictions are reliable.
Finally, the business can display the forecasts in its existing reporting environment so purchasing managers can compare expected demand with current inventory.
Forecasting accuracy should be monitored after deployment because customer behavior and operating conditions can change.
Where can organizations apply predictive BI?
Predictive business intelligence supports planning across industries where historical information can help estimate future conditions. The most useful applications generally address a specific decision that business users make repeatedly.
| Industry | Application | Decision supported |
| Manufacturing | Equipment failure forecasting | When to schedule maintenance |
| Retail | Product demand forecasting | How much inventory to purchase |
| Healthcare | Patient volume forecasting | How to plan staffing and capacity |
| Financial services | Credit risk estimation | How to assess lending applications |
| SaaS | Customer churn prediction | Which accounts need retention attention |
For example, a SaaS company may already monitor customer retention through monthly BI reporting.
By introducing churn prediction, the company can analyze customer activity, support history, and subscription information to estimate which accounts face a higher likelihood of cancellation.
Account managers can then investigate those customers and decide whether intervention is appropriate.
The prediction provides an additional input into the decision. Human judgment remains necessary, particularly when the underlying data cannot explain every factor influencing customer behavior.
How is AI-powered business intelligence changing reporting and analytics?
AI-powered business intelligence applies machine learning and other AI techniques to support reporting, forecasting, and data exploration. Depending on the platform, these capabilities may include natural-language queries, automated anomaly detection, or generated explanations of business metrics. Their reliability depends on the underlying data and how the tools are configured.
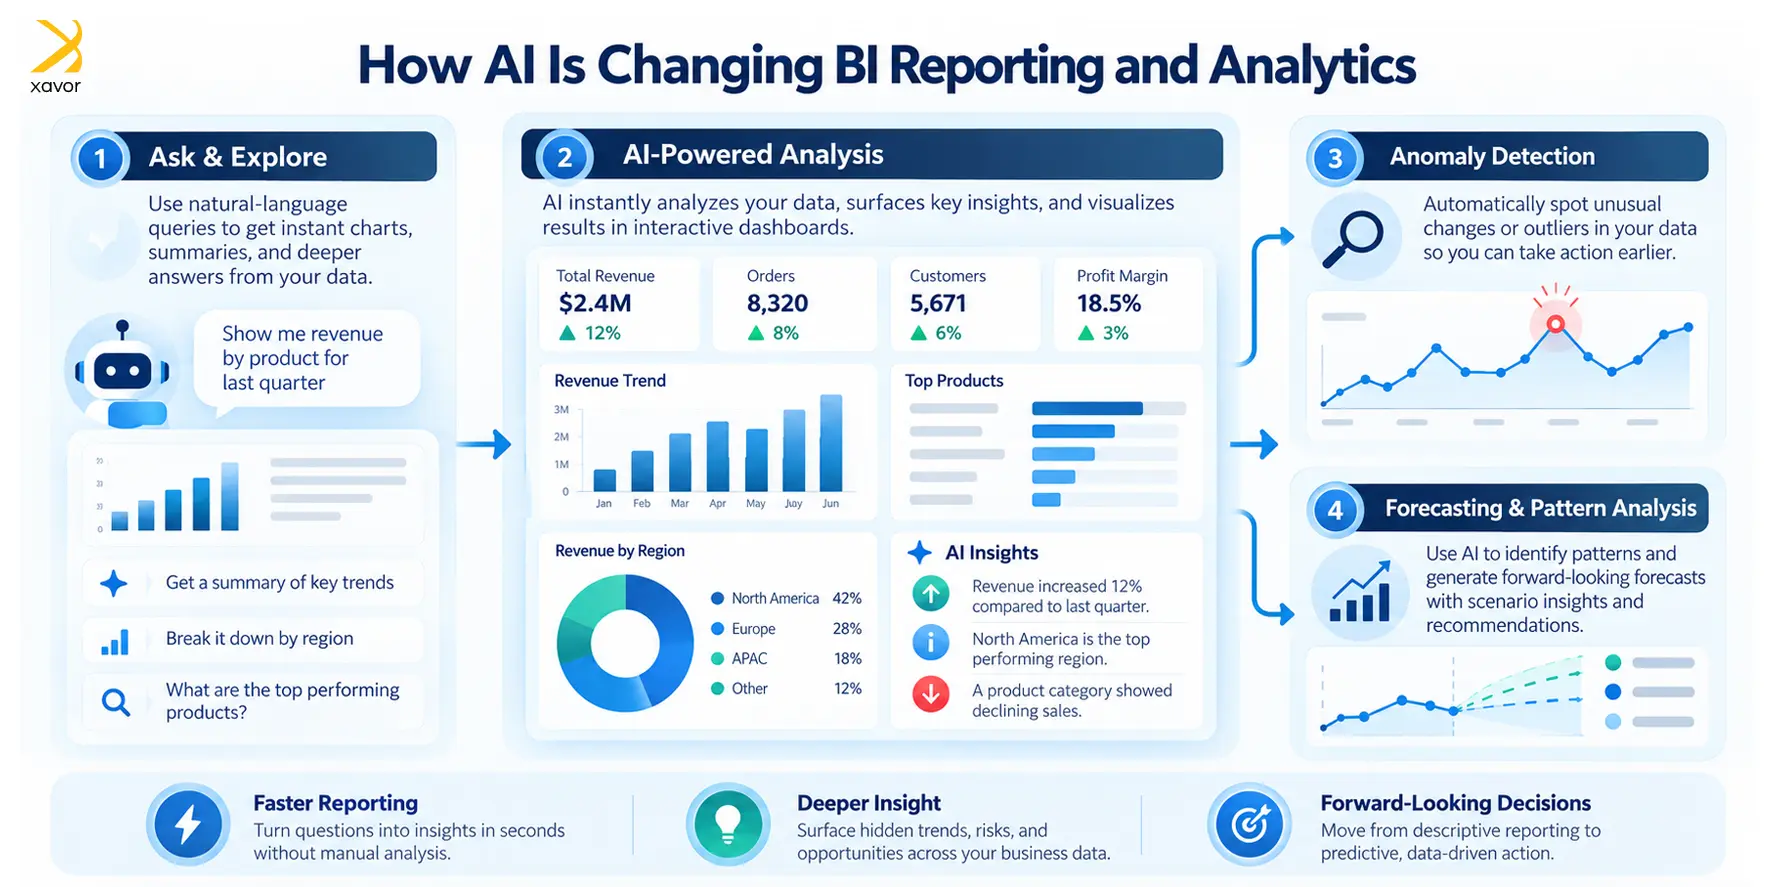
For example, Microsoft Power BI supports anomaly detection in certain time-series line charts. The feature identifies unusual data points and can suggest possible explanations using available report dimensions.
However, Microsoft’s documentation identifies specific limitations, including chart configuration requirements and unsupported connection scenarios.
Introduce another useful capability. Business users may be able to ask questions about revenue or operational performance without manually constructing every report.
However, AI-generated responses still require verification, particularly when organizations use the information for financial or operational decisions.
Analysts remain responsible for defining business measures, interpreting unusual results, and evaluating whether the available evidence supports a conclusion.
Why does the BI semantic layer matter for accurate analytics?
A BI semantic layer defines business measures, relationships, and terminology over underlying data. It helps different reports calculate metrics consistently and gives analytical tools a common representation of business information. This becomes especially useful when organizations combine conventional reporting with machine learning or natural-language analytics.
Consider a company with several definitions of revenue.
The finance department calculates revenue using invoiced transactions, while sales reports use booked orders. Both measures may be useful, but they answer different questions.
Without clearly defined metrics, a forecasting model trained on one definition may produce results that users compare incorrectly with another.
A semantic model reduces this risk by defining how calculations work and which data relationships apply.
Microsoft’s Power BI documentation explains how semantic models organize business logic and reusable calculations to support consistent reporting and AI-based queries.
Semantic models also require maintenance. Changes to source systems, reporting definitions, or business processes can affect downstream analytics.
How can businesses introduce predictive analytics into existing BI systems?
Organizations can introduce advanced analytics gradually by improving existing data processes and selecting a specific forecasting use case. They should begin with a measurable business problem, assess the available information, validate a suitable model, and connect its results to the reporting tools employees already use.
A practical implementation follows five steps:
- Assess data readiness. Review data completeness, refresh frequency, and consistency across source systems.
- Standardize business measures. Establish shared definitions for the KPIs used in reporting and forecasting.
- Select one forecasting use case. Choose a recurring decision where improved estimates could reduce costs or support planning.
- Test the model. Compare predictions with actual historical outcomes and a simple baseline forecast.
- Monitor production performance. Track forecast errors and review whether employees use the results appropriately.
For instance, an organization using Microsoft Power BI may retain its existing dashboards while developing a separate forecasting model.
Depending on the technical requirements, model outputs can be stored in a database or analytical platform and consumed by Power BI reports.
Organizations considering broader infrastructure changes can also review Xavor’s article on how cloud BI affects business decision-making.
The implementation should also account for data access controls, model ownership, and ongoing maintenance.
What should organizations measure to evaluate predictive BI?
The effectiveness of predictive BI depends on both technical performance and business outcomes.
Forecast accuracy is one useful measure. Organizations may track mean absolute error (MAE) or weighted absolute percentage error (WAPE), depending on the characteristics of the data.
However, a technically accurate forecast may still have limited business value if employees receive it too late or cannot connect it to an operational decision.
Therefore, organizations should also measure whether forecasting improves planning outcomes, such as inventory availability, staffing decisions, or maintenance scheduling.
These measures help determine whether further investment in the analytical system is justified.
Predictive business intelligence gives organizations another way to use their existing information. Historical dashboards establish performance, while forecasting models help decision-makers prepare for possible future conditions.
At Xavor, we develop business intelligence and data analytics solutions that connect data preparation, semantic modeling, interactive reporting, and advanced analytics. If your organization wants to introduce forecasting into an existing BI environment or improve the reliability of its business intelligence reporting and analytics, contact us at [email protected].

FAQs
BI reporting typically presents historical and current performance through dashboards and KPIs. Predictive analytics applies statistical models to estimate future outcomes using patterns in available data.
AI-powered business intelligence can support automated anomaly detection, natural-language questions, and forecasting. These capabilities help users investigate information, although model outputs still require appropriate validation.
A BI semantic layer defines business measures and relationships consistently across reports. It reduces conflicting calculations and helps analytical tools interpret business data correctly.