Introduction of GNN
The structured data in data science and machine learning is in the form of spreadsheets and tables. You see rows and columns of data in SQL databases, CSV or JSON files, Pandas DataFrames, and other formats. However, we consider these data points to be separate from one another.
The traditional way of dealing with structured data in machine learning is sequential. You have to consider developing some kind of model once you have data and have had enough time to undertake exploratory data analysis (EDA) and data cleansing.
Maybe you want to predict a label through binary classification. Or you may be attempting to anticipate a value using regression analysis.
Whatever your ultimate objective, you should consider developing a vector or embedding where you can convert your data into a numerical input for your model. You might need to encode a column of “True / False” values into 1s and 0s. Or perhaps there is a text that needs to be vectorized in some way using natural language processing (NLP) methods.
Whatever method you use, you need to adjust the values. Ultimately, you will have a vector of numbers that you can train using programs like sci-kit-learn, TensorFlow, PyTorch, etc. You can now use this trained model to predict outcomes based on the new data.
But the critical question is, how can one construct a model where one row might be dependent upon another? Before answering this question, let’s take a brief historical overview of the conventional machine learning methods used to analyze structured data.
A Brief Overview of Conventional Machine Learning
While different, largely independent approaches to the problem of mathematical modeling of complex systems evolved, one aspect—data representation—remained almost universal.
In actuality, even though the mathematical forms of the hypotheses and models have historically significantly varied – from analytical expressions and differential equations used in the control theory to decision trees – the input-output observations have traditionally been restricted to the form of numeric vectors and neural networks currently used in ML.
This seems only natural. Since the invention of computers, we have developed a strong habit of converting any attribute of interest into a number, whether it be a physical quantity like force or voltage or an emotion like happiness or a preference for ketchup over mustard.
Each measurement of a system of interest, which may be anything from a power plant to a human, using numerous input (X) and output (Y) variables, reduces to a specific vector of integers known as a feature vector.
However, there is yet another compelling argument for why feature vectors are so desirable. Treating each data sample (measurement) as a separate point in an n-dimensional space makes it possible to use the tried-and-true linear algebraic machinery, which has been used for hundreds of years in engineering from other fields.
It’s challenging to understand that the pre-processing of our data into a table (or tensor) of numbers, required as the input format in nearly every ML package, is only part of the whole data representation.
Just have a look around to observe how actual data from the real world appears. It isn’t kept in tensors or numerical vectors but in the interconnected structures of websites, social networks, knowledge graphs, and databases for biology, chemistry, engineering, and so on. These are naturally stored in graphs, hypergraphs, and relational databases and are intrinsically relational data.

The Critical Role of Graphs in Machine Learning
This brings us to network graphs, where we may see which data points are linked to which others through a single relationship or a network of connections.
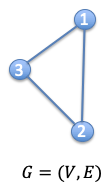
A graph is a type of data structure made up of vertices and edges. It serves as a mathematical framework for examining the relationships between items and things pairwise same like edge and cloud.
A graph is typically defined as G = (V, E), where V is a collection of nodes and E is the connections between them. Adjacency matrices, or A, are frequently used to represent graphs. The dimension of A has N nodes if a graph has N nodes (NxN).
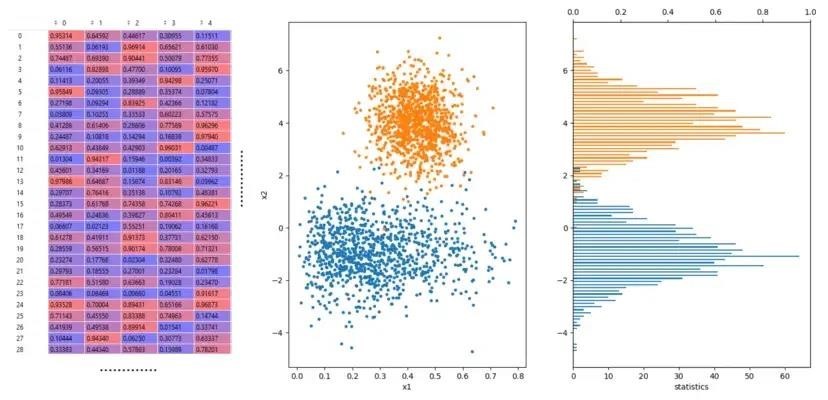
To further explain the nodes in the network, people occasionally offer another feature matrix. If each node has an F-number of features, then X is the dimension of the feature matrix (NxF).
A graph is typically challenging for humans to visualize. We are not referring to little graphs like those in the preceding examples but to enormous graphs with hundreds or thousands of nodes. Here’s an example of what a complex graph looks like:
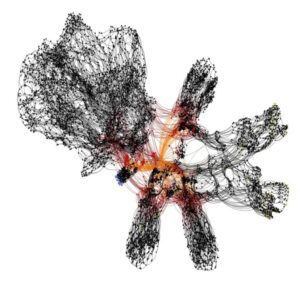
Logic Gates in an Integrated Circuit
Such a graph is challenging for a person to comprehend because of the large dimensions and densely packed nodes. As a result, programming a machine to perform this activity is complex.
Graph Neural Network (GNN)
So, what is a Graph Neural Network (GNN)? It is a neural network that operates on graphical data by directly manipulating it. GNNs have been the focus of research over the last decade.
The capacity of Graph Neural Networks (GNN) to evaluate graph structure data has recently attracted a lot of interest.
Graphs are ubiquitous; the definitions of actual world objects frequently depend on how they link to other things. A graph naturally expresses a collection of things and the relationships among them. Their capacities and expressive power have improved recently.
Node categorization is a typical use of GNN. In essence, each node in the graph has a corresponding label, and in the first paper of the GNN, we aim to predict the label of the nodes without using any ground truth.
You can use GNN to do the following:
- Node Classification
- Link Prediction
- Graph Classification
We are beginning to see real-world applications of GNNs in fields like the discovery of new antibiotics, physics simulations, fake news detection, traffic prediction, business benefits, and recommendation systems.
Modeling Data for Graphical Representation
Nodes stand for significant entities, subjects, or objects. We may benefit from the connected aspect of the network by using a variety of node kinds. As an illustration, if our data set includes information about people and places with additional metadata or qualities for each, we will create nodes for each and connect them using relationships or edges. We must follow the same procedure per dataset. We’ll decide which nodes in our dataset are crucial.
Conclusion
GNN is the most recent advancement in the field of Machine Learning. It allows us to explore and get out of the traditional ways of solving and analyzing structured data.
Although it may be challenging to understand and adopt, it is still worth applying to analyze large datasets since connecting these will help us develop connections between extensive in-depth analytics to bring out granular insights.
Do you need assistance with using GNNs for analyzing structured data? Contact us at [email protected], and our team will get in touch with you.