

eCommerce analytics tools collect and report data about how a store performs, and they divide into four domains: behavioral analytics, attribution, retention, and profitability. We build reporting across systems at Xavor Corporation in Irvine, California, through our BI and data analytics services, which is how we came to write this. Six criteria decided which tools appear here. Behavioral tools report what shoppers did, attribution tools report which channel brought them, retention tools report what they are worth over time, and profitability tools report which of that revenue made money. A brand under two million in revenue and a brand over twenty million have different problems, and the second one is usually reconciliation.
No single eCommerce analytics tool covers behavioral, attribution, retention, and profitability well, which is why most brands end up running several.
How we picked these seven
Six criteria decided which tools appear here, and the same six decide what each entry says, so the reasoning is checkable against the entries themselves.
- Domain served: behavioral, attribution, retention, profitability, reporting, or warehouse.
- Where its numbers originate: a tag on your site, a pixel you own, another platform’s API, or your own warehouse.
- What it connects to: named systems rather than a count.
- Where it breaks: catalog size, channel count, or data volume.
- Pricing model: flat, revenue-tiered, order-tiered, usage-based, or quote-only.
- Who it suits: revenue band and team shape.
Two rules follow from those criteria. Every tool here gets one named limitation, in the same position, with no exceptions. And no entry states a monthly price.
Most tools in this category price against a moving number, so a published figure describes one brand’s bill rather than the tool’s cost. Checking one vendor’s own pricing page against six third-party lists produced seven different monthly figures for the same product in the same year, ranging from under $150 to over $4,000. The vendor’s own page does not publish a fixed number at all. It moves a slider against revenue.
Connector counts have the same problem. Three sources describe the same platform as carrying 100, 500, and 1,000 integrations. Named connections appear in the entries below; counts do not.
Xavor builds reporting on Microsoft Power BI and Snowflake for enterprise clients. That work informs the warehouse entry and is disclosed there. Xavor has no commercial relationship with any tool on this list and earns nothing from a click.
The four questions eCommerce analytics tools answer
Behavioral tools report what shoppers did, attribution tools report which channel brought them, retention tools report what they are worth over time, and profitability tools report which of that revenue made money. Most stacks contain tools from at least two of the four.
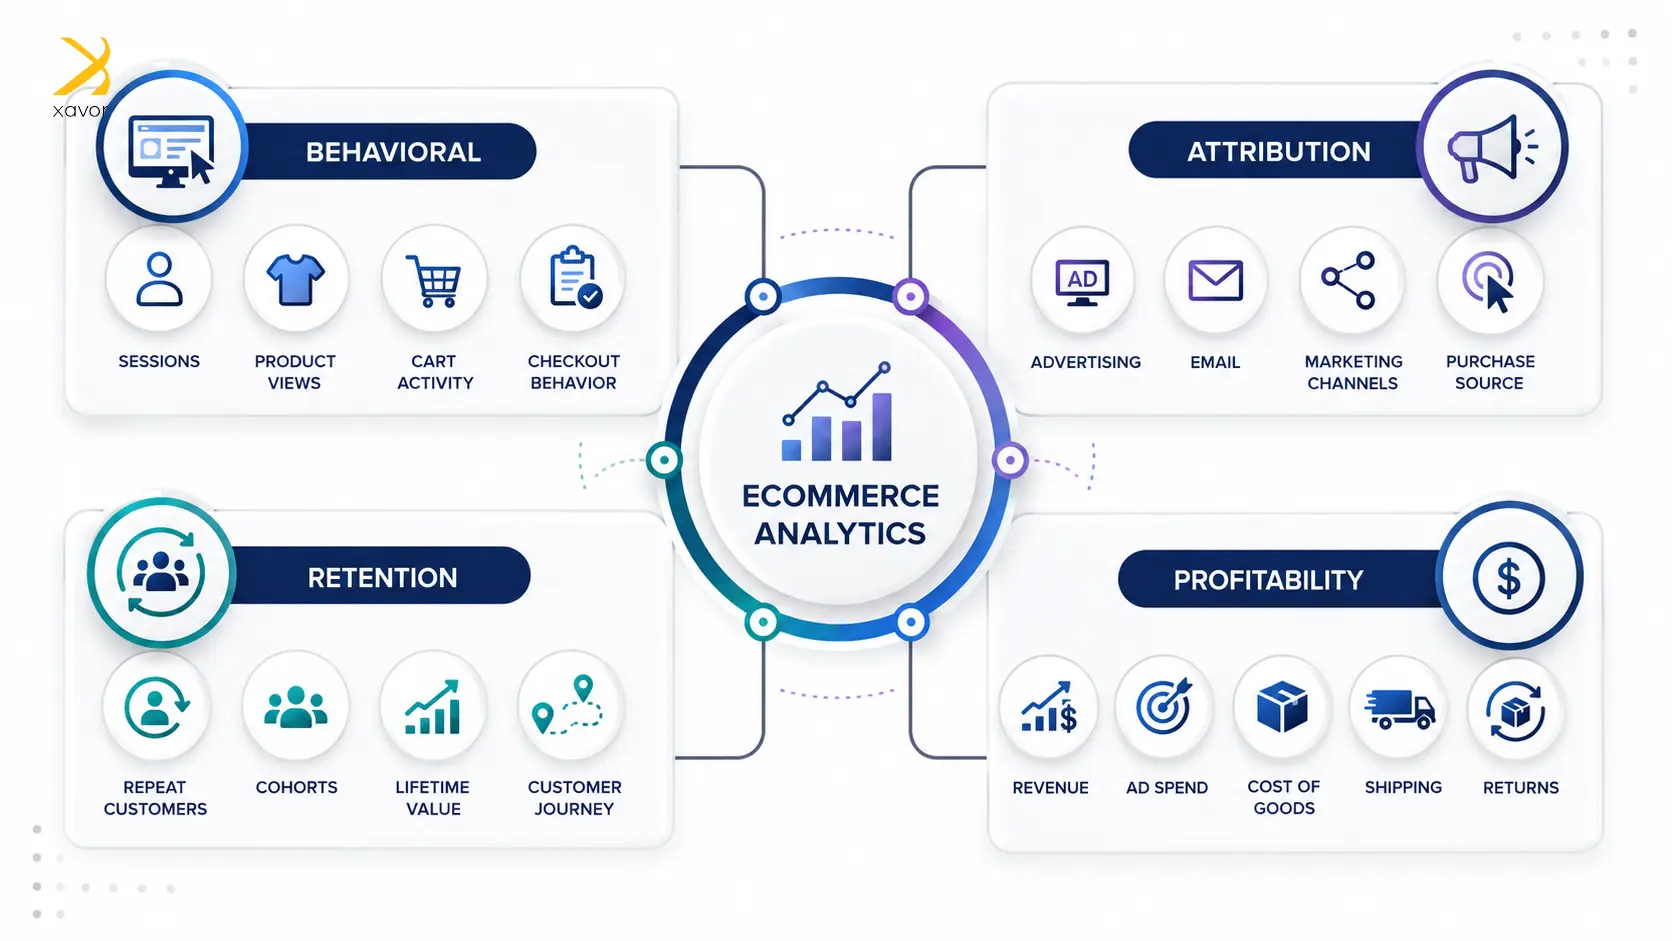
- Behavioral: sessions, product views, cart events, checkout drop-off. Answers what happened on the site.
- Attribution: which ad, email, or channel preceded the purchase. Answers where demand came from.
- Retention: repeat rate, cohort behavior, lifetime value. Answers what a customer is worth after the first order.
- Profitability: revenue minus ad spend, cost of goods, shipping, and returns. Answers which of it was worth having.
eCommerce reporting tools and eCommerce marketing analytics platforms sit across these domains rather than inside one, which is part of why the category confuses buyers. So does eCommerce tracking software, which usually means the behavioral layer specifically.
Where a tool’s numbers originate decides which number to trust when two tools disagree about the same month.
A platform reading its own pixel, a platform reading an ad network’s API, and a warehouse reading the order table will each produce a defensible revenue figure, and they will differ. Reconciling them is the integration work that connects analytics sources, and it is an engineering task rather than a purchasing one.
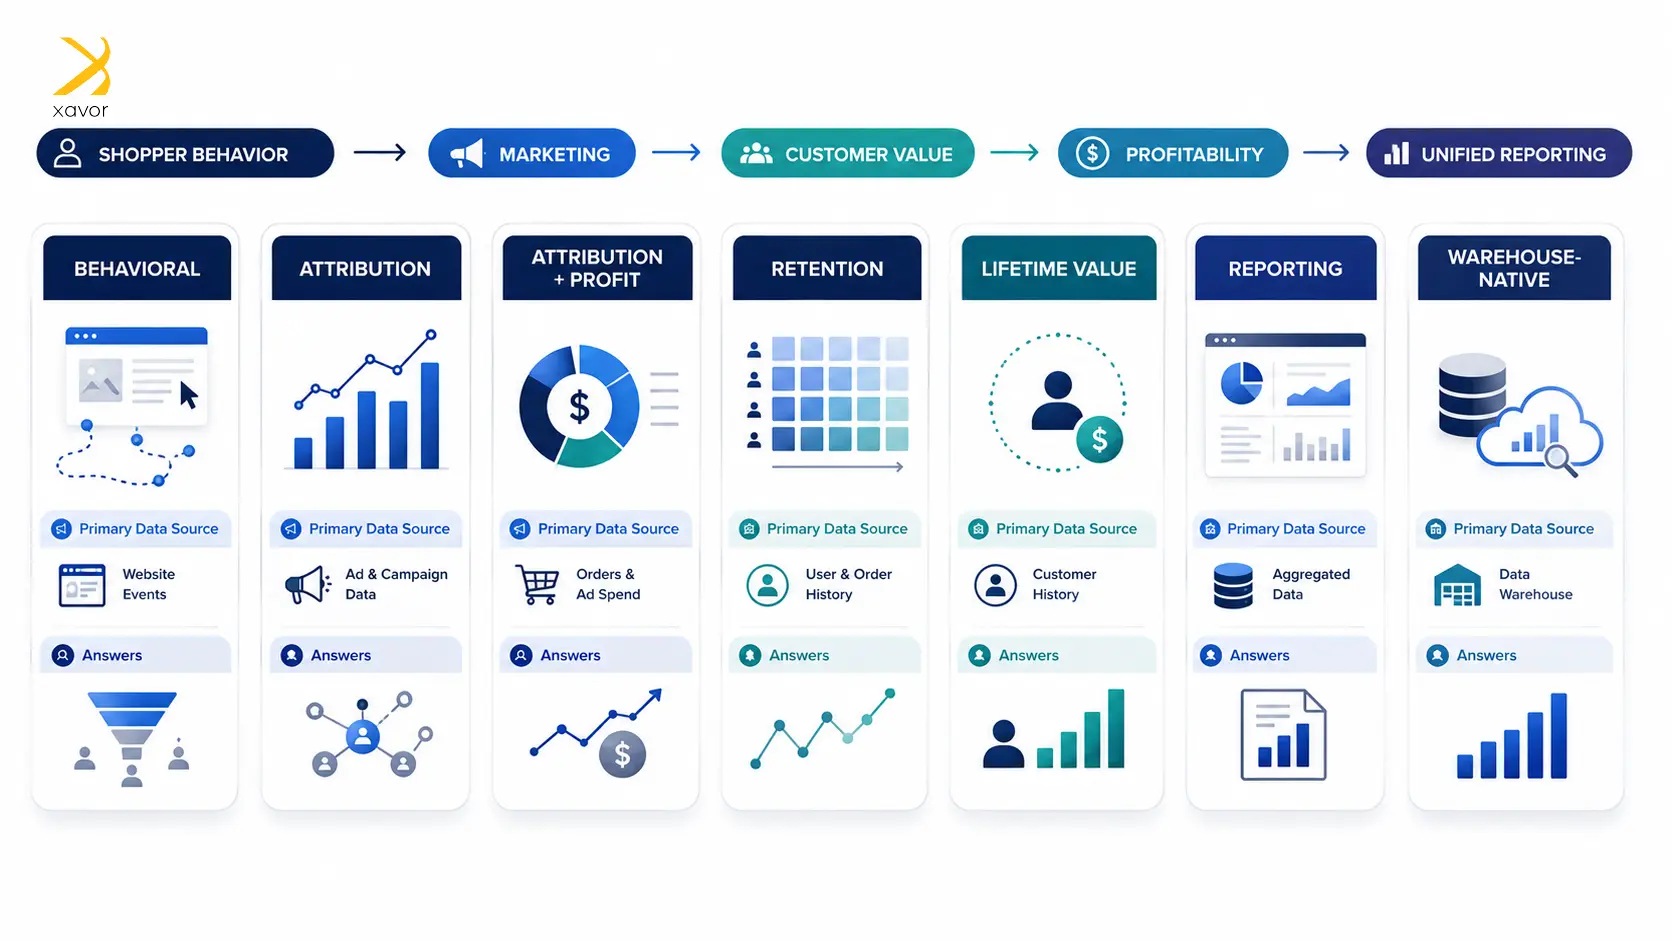
The seven tools, by domain
1. Google Analytics 4
Behavioral. GA4 collects event data from tags placed on your own site and app, recording product views, cart actions, and purchases as discrete events rather than page sessions.
Its numbers come from your property directly, which makes it the closest thing the category has to a common baseline. Most other tools on this list assume it is already running.
Fits: every store, as the foundation layer.
Limitation: cross-device and cross-session tracking has degraded since platform privacy changes, so GA4’s view of a journey spanning several devices is less complete than its reporting implies. Treat it as authoritative for on-site behavior and secondary for cross-channel attribution.
2. Triple Whale
Attribution and profitability. Triple Whale runs its own pixel on the store and ties completed purchases back to the ad clicks that preceded them, then subtracts spend and cost inputs to report profit rather than revenue.
Its numbers come from a first-party pixel it controls, which is a different source from GA4’s tags and from an ad platform’s self-reported conversions. That independence is the reason to use it.
Fits: Shopify-based DTC brands running paid media across several channels.
Limitation: the platform is built around Shopify, and its own pricing page prices against gross merchandise value rather than publishing a flat figure, so the cost rises as the store grows. A free tier exists for brands testing fit before committing.
3. Northbeam
Attribution. Northbeam combines multi-touch attribution with media mix modeling on a first-party data foundation, and reports at channel, campaign, and creative level rather than at channel level alone.
Its numbers come from its own first-party collection joined to ad platform data, and its attribution model credits verified impressions alongside clicks. That produces a different answer from click-only models, which is the point of running it.
Fits: brands where paid media spend is large enough that a misallocation costs more than the platform.
Limitation: the entry tier on Northbeam’s own pricing page is scoped to brands already spending meaningfully on ads, and the upper tiers require a sales conversation, so it is not a tool a smaller brand grows into gradually. Reviewers consistently describe a learning curve.
4. Klaviyo
Retention and channel attribution. Klaviyo is an email and SMS platform whose analytics layer reports the revenue its own campaigns and flows produced, alongside customer-level metrics including predicted lifetime value and churn probability.
Its numbers come from its own sending infrastructure joined to store order data. Attribution windows and touchpoints are configurable and apply retroactively, which means the same period can report different revenue depending on how the model is set.
Fits: brands where email and SMS carry a significant share of revenue.
Limitation: it attributes revenue to its own messages, so it answers questions inside one channel and cannot arbitrate between channels. A campaign Klaviyo credits may also be credited by an ad platform for the same order.
5. Lifetimely
Retention and lifetime value. Lifetimely, now part of AMP, reads store order history alongside ad spend to produce a profit and loss view, predictive lifetime value, and cohort analysis showing how long a cohort takes to repay its acquisition cost.
Its numbers come from the order table joined to advertising accounts, which makes them harder to dispute than modeled attribution and slower to arrive.
Fits: brands whose next decision depends on repeat purchase behavior and cohort payback.
Limitation: its attribution is first and last touch only, so a team running multi-channel paid media needs a dedicated attribution tool beside it. Its pricing scales with order volume rather than revenue, which suits high-value baskets and penalizes high-volume, low-price catalogs.
6. Improvado
Reporting and unification. Improvado is an extraction and transformation layer that pulls from marketing and commerce sources, normalizes them, and delivers the result into a warehouse or a BI tool.
Its numbers come from the upstream platforms’ APIs, which means it inherits their definitions. A channel that counts a conversion generously upstream counts it generously here.
Fits: teams consolidating many sources who have already decided which definitions to trust, and who have a BI layer to present the output.
Limitation: it is a pipeline rather than a reporting product, so it pairs with a BI tool rather than replacing one, and the setup assumes technical capacity. Its own pricing runs from a free tier through plans sized by ad spend, revenue, and source count, with the larger tiers quoted. Worth noting that Improvado also publishes a competing list of these tools.
7. Microsoft Power BI on a warehouse
Warehouse-native. This is the option the other lists omit. Rather than a tool that models your data for you, the store’s orders, ad spend, and cost data land in a warehouse you own, and a BI layer reports from there.
Its numbers come from your warehouse, which means you define them once and every team reads the same definition. That is the only arrangement on this list where a disagreement between dashboards is a bug rather than a modeling difference.
Fits: brands past the point where adding another dashboard resolves disagreement between existing dashboards.
Limitation: it requires a warehouse, a pipeline, and someone to maintain both, which is a larger commitment than a subscription and a slower path to a first result.
This is the path we build, and the disclosure above applies. Our write-up on standardizing global data reporting on Power BI and Snowflake covers the delivery, and how Snowflake and Databricks compare as a warehouse layer covers the layer beneath it.
The seven compared
The columns below map to the six criteria, in the order they were stated.
| Tool | Domain | Numbers come from | Pricing model | Best fit | Main limitation |
|---|---|---|---|---|---|
| Google Analytics 4 | Behavioral | Tags on your site | Free tier, paid enterprise | Every store | Cross-device gaps |
| Triple Whale | Attribution, profit | Its own pixel | Revenue-tiered, free tier | Shopify DTC with ad spend | Shopify-centric |
| Northbeam | Attribution, MMM | First-party plus ad APIs | Ad-spend tiered, quoted above entry | Larger paid programs | Assumes significant spend |
| Klaviyo | Retention, channel | Its own sends | Contact-tiered | Email-led brands | Credits its own channel |
| Lifetimely | Lifetime value, profit | Order history plus ad spend | Order-volume tiered | Cohort and payback questions | First and last touch only |
| Improvado | Reporting pipeline | Upstream APIs | Free tier, then quoted | Many-source consolidation | Needs a BI layer |
| Power BI on a warehouse | Warehouse-native | Your warehouse | Per-user plus warehouse | Post-fragmentation | Needs maintenance |
Choosing for your stage
A brand under two million in revenue and a brand over twenty million have different problems, and the second one is usually reconciliation rather than coverage.
- Early: one behavioral tool, configured properly. Coverage gaps are cheaper to fix than bad data.
- Growing: add attribution once paid spend is large enough that misallocating it costs more than the subscription.
- Fragmented: stop adding tools. The problem has become definitional rather than technical.
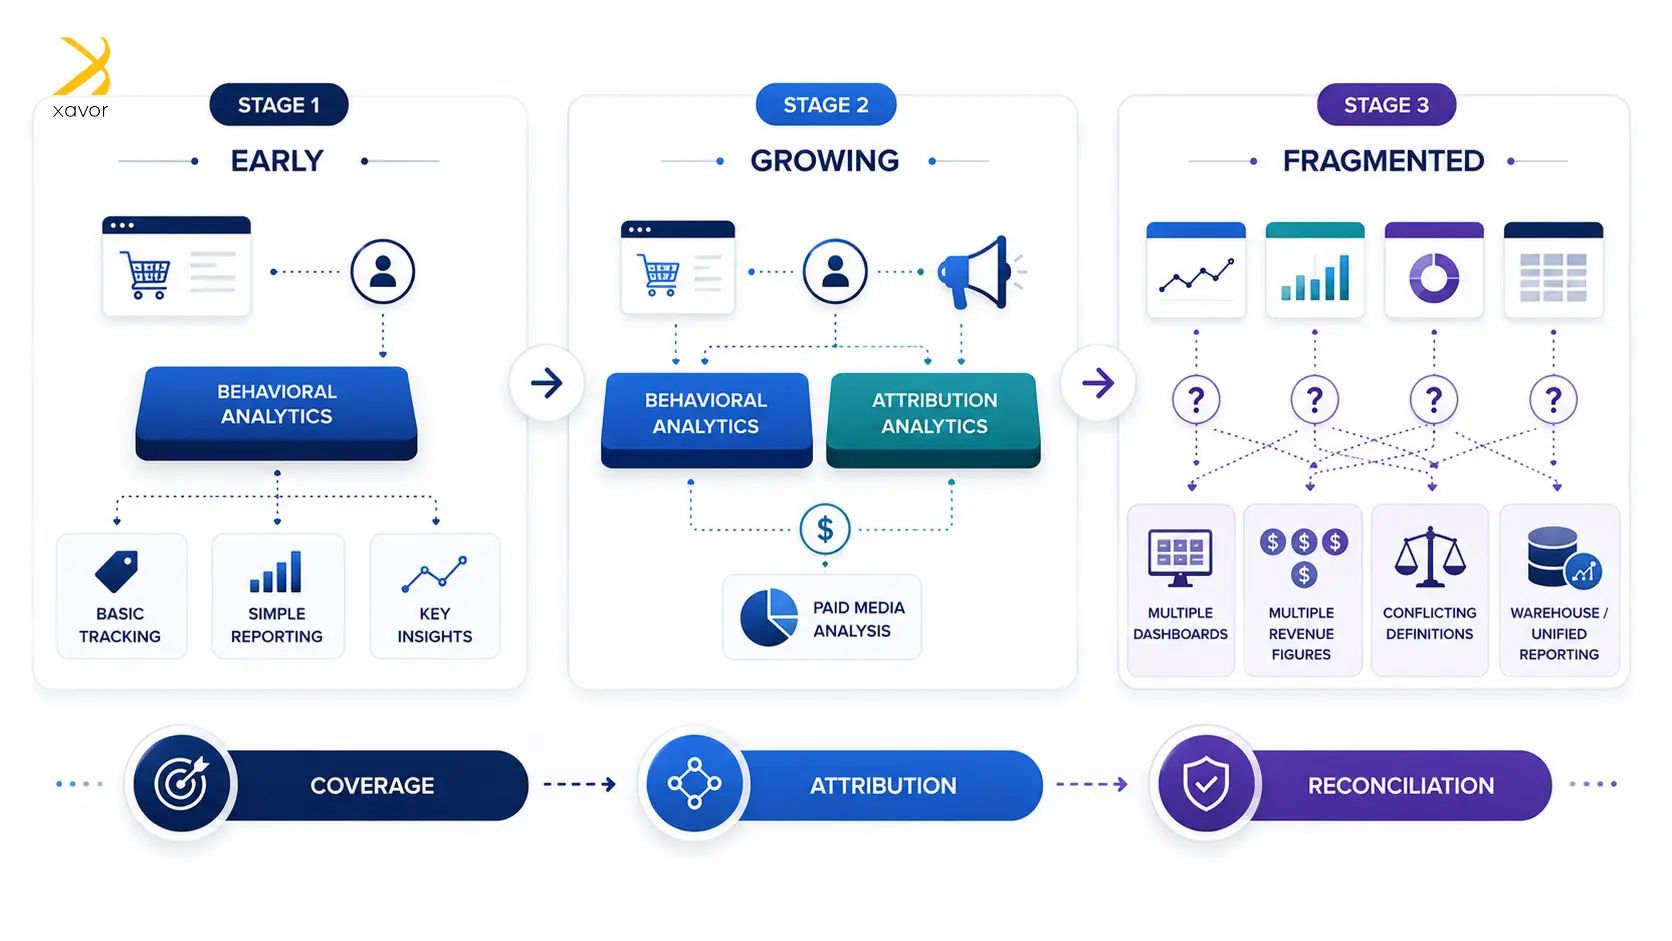
The third stage is where most stacks stall. Four platforms report four revenue figures, finance trusts none of them, and the instinct is to buy a fifth that promises to unify the rest.
Adding a fifth tool to fix disagreement between four tools adds a fifth opinion.
What resolves it is deciding which source is authoritative for each metric and building the reporting from there, which is closer to what business intelligence services cover than to a software purchase.

FAQs
eCommerce analytics is the collection and reporting of data about how an online store performs, spanning shopper behavior, marketing attribution, customer retention, and profitability. Most brands use several tools because no single platform covers all four areas well.
Attribution tools report which channel produced a sale. Profitability tools subtract ad spend, cost of goods, shipping, and returns to report which sales produced margin. A channel can lead on attribution and lose money on profitability.
Fewer than most run. The useful test is how many distinct questions the stack answers rather than how many platforms it contains. Two tools covering different domains beat four tools reporting overlapping versions of the same metric.