
Unplanned disruptions are among the most costly and disruptive problems in manufacturing. One unexpected stoppage can affect upstream and downstream operations, throw off schedules, increase overtime, and put customer commitments at risk. When disruptions occur repeatedly across multiple production lines, OEE software becomes essential to maintaining consistent, predictable Overall Equipment Effectiveness (OEE).
Many manufacturers still operate in a reactive mode. Equipment fails, teams respond, production restarts, and the same issues recur.
Manufacturing data analytics changes this cycle. By using real-time and historical data, organizations can spot patterns early, identify leading indicators of failure, and take preventive action that improves consistency across lines. With the right data analytics solutions, manufacturers can move beyond basic reporting and build reliable, repeatable performance across production environments.
This article explains how manufacturing data analytics can reduce unplanned disruptions and help stabilize OEE across production environments.
What is data analytics in manufacturing?
Data analytics in manufacturing is the process of collecting, combining, and analyzing production data to understand what is happening on the shop floor and how to improve it. Instead of relying only on manual reports or gut feel, teams use real data to make faster and more accurate decisions.
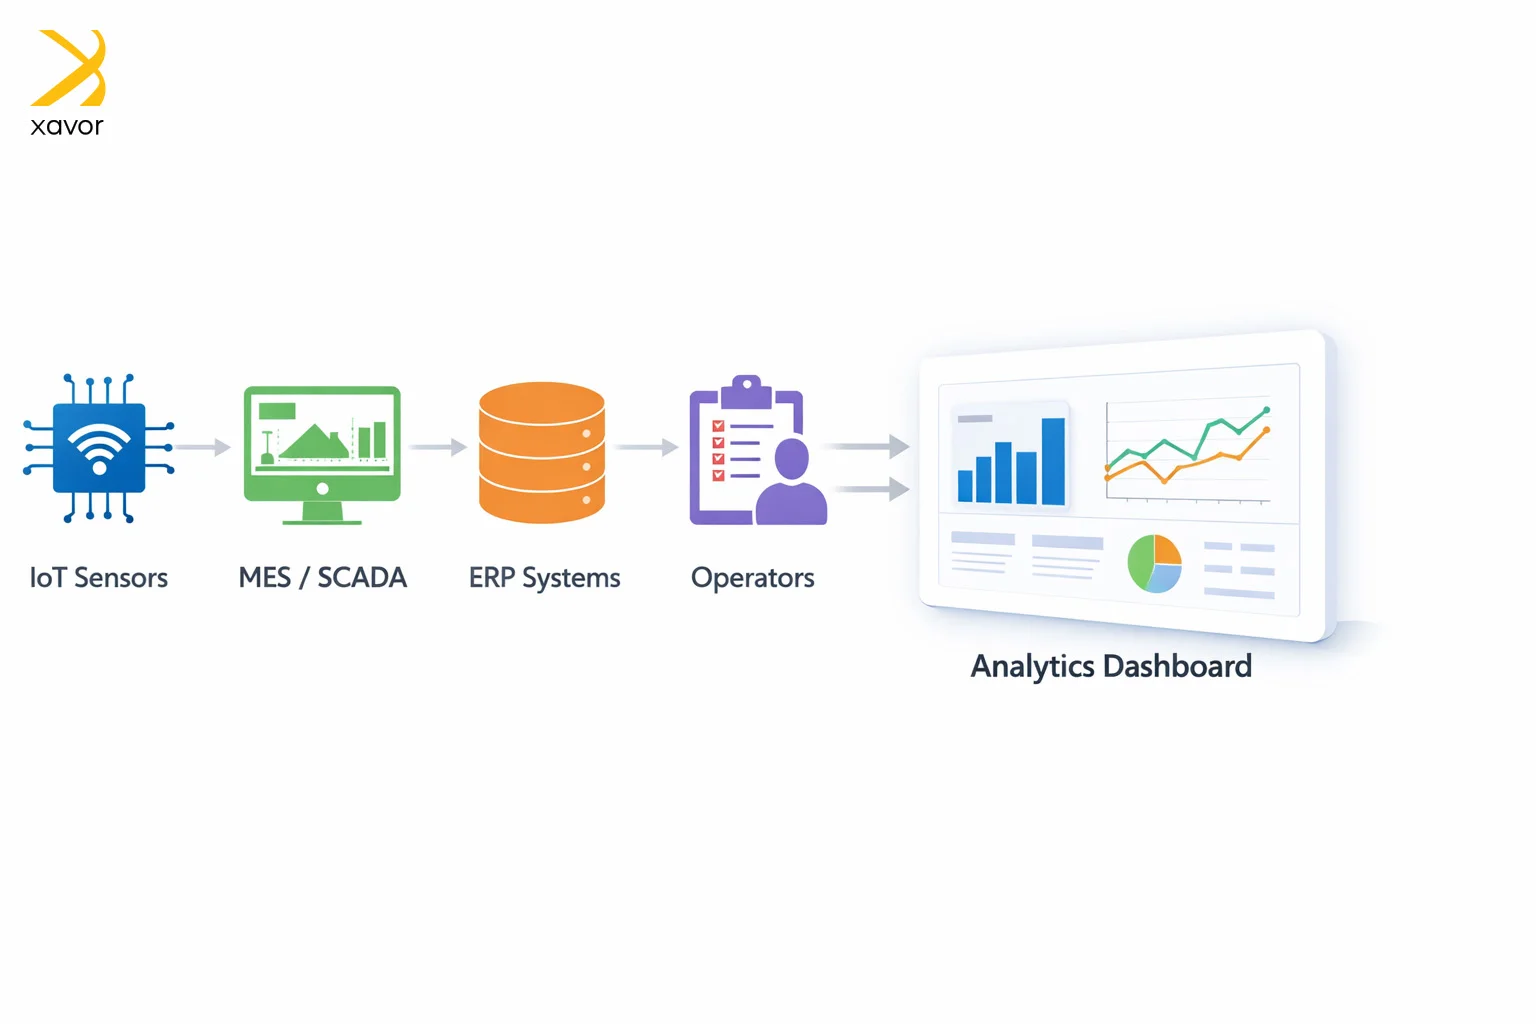
This data can come from many places, including:
- IoT sensors that track vibration, temperature, pressure, energy use, and cycle time
- MES and SCADA systems that record machine status, production counts, alarms, and downtime
- ERP systems and maintenance logs that show work orders, inventory, costs, and repair history
- Operator input, such as shift notes, quality checks, and reasons for stoppages
The goal is to turn all of this information into clear, powerful data insights. For example, analytics can show which machines stop most often, which shifts have higher defect rates, or which process settings lead to better quality. It can also help predict future failures and quality issues so that teams can take action early.
In short, manufacturing data analytics helps manufacturers move from reacting to problems after they happen to preventing them before they cause delays, scrap, or downtime.
Why unplanned disruptions create OEE instability
Unplanned disruptions include breakdowns, minor stops, slow cycles, and quality interruptions. These events show up in all three parts of OEE:
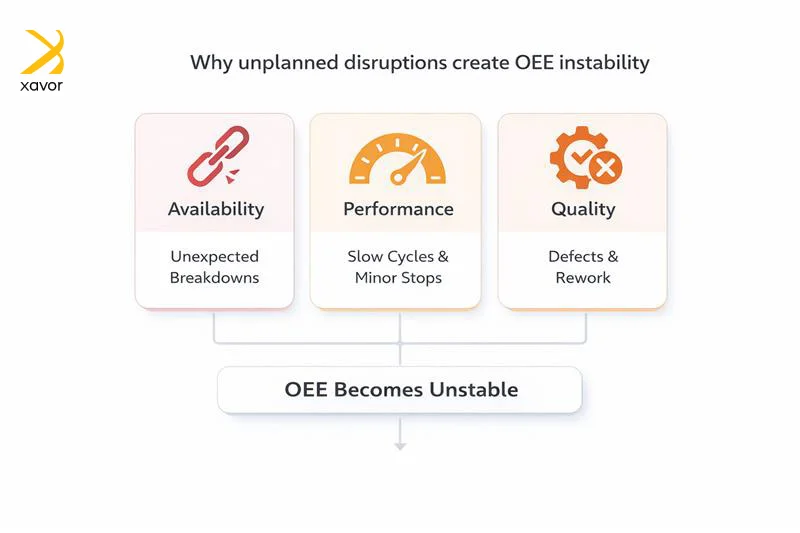
- Availability drops when machines stop unexpectedly
- Performance drops when lines run slower than the standard rate
- Quality drops when defects increase, or rework grows
OEE becomes unstable when these losses are inconsistent. The same product can run smoothly on one line and struggle on another. The same line can perform well on one shift and poorly on the next. In many cases, the problem is not effort. The problem is visibility and consistency of measurement.
The real cost of instability across lines
Most manufacturers understand downtime costs, but instability across lines creates losses that go beyond minutes and hours. When performance varies from one line to another or from shift to shift, the operation loses predictability. That unpredictability affects scheduling, staffing, governance, quality control, and on-time delivery, even when individual stoppages seem manageable.
The impact is often larger than the original disruption because recovery work compounds. Plans change late in the day, teams rush to catch up, and process conditions become less controlled during restarts and adjustments. Over time, instability reduces effective capacity because the plant cannot rely on consistent output from run to run.
Key impacts usually include:
- Lost production and missed schedules because output cannot be forecast reliably
- Overtime and rushed changeovers because recovery happens under time pressure
- Increased scrap and rework because restarts and frequent interventions introduce variation
- Longer repair cycles because failures are unplanned, and support is not ready immediately
- Lower planning confidence because performance does not repeat consistently
This is why stabilization matters. A plant can push for a strong OEE number for a short period through extra focus and effort. Stability means performance stays consistent across lines, shifts, and product runs, which is what makes improvement sustainable and planning dependable.
Common causes of unplanned disruptions that analytics can expose
Most disruptions have a cause, but many manufacturers struggle to confirm them consistently. One reason is that important signals are spread across systems. Another reason is that the same problem gets labeled differently across lines.
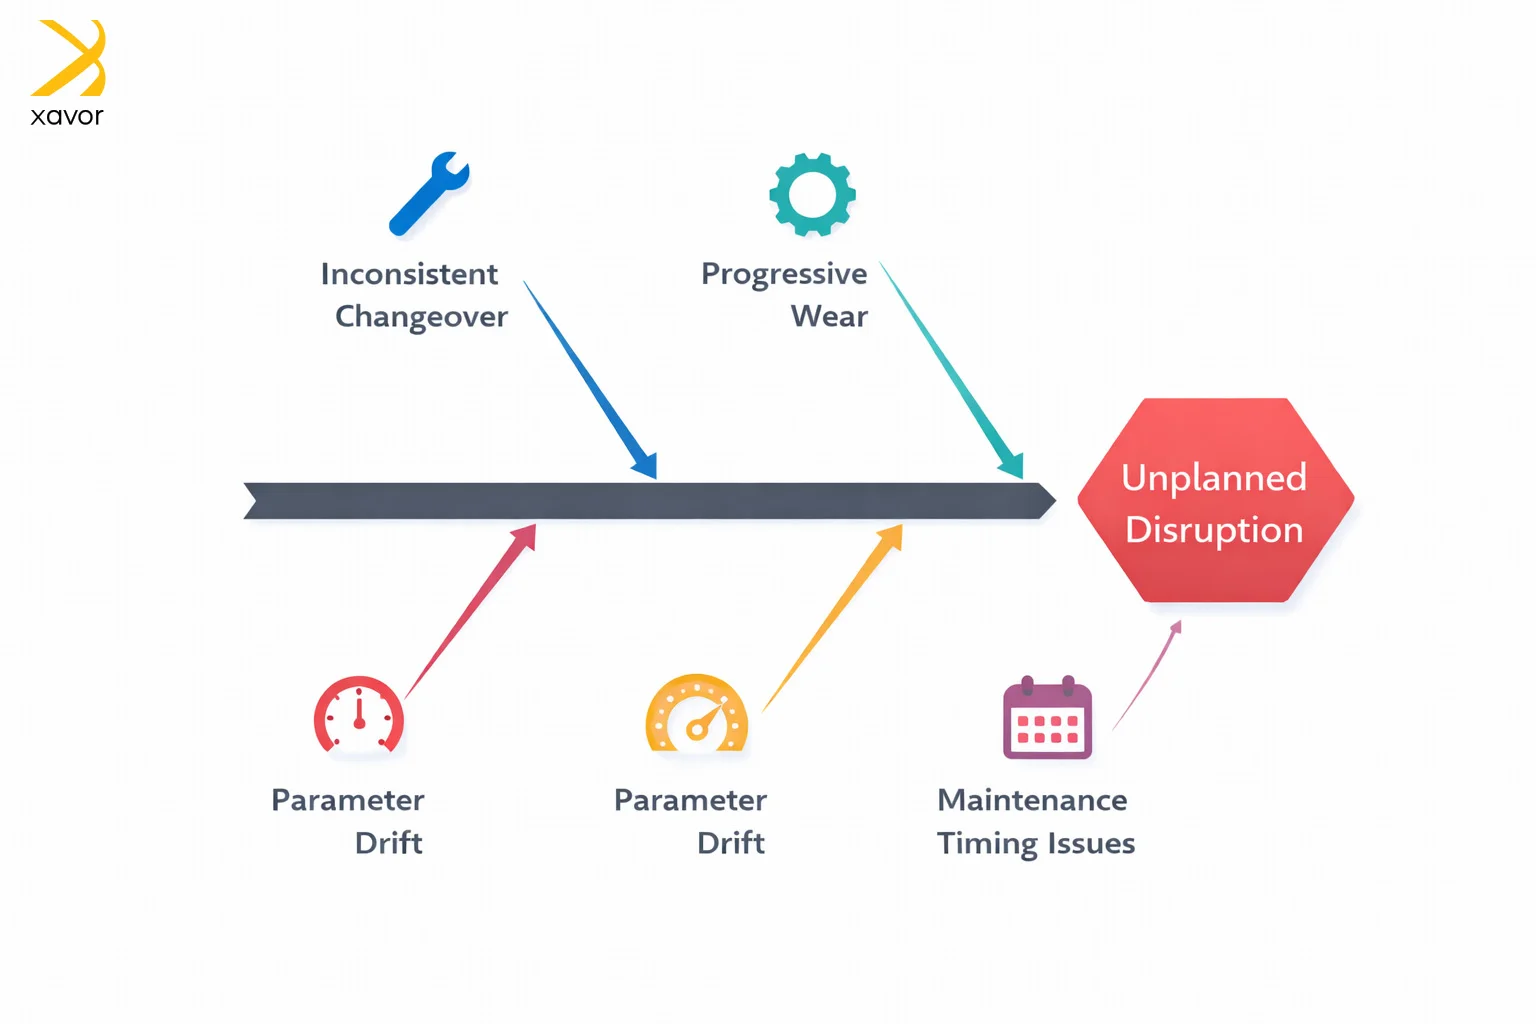
Manufacturing data analytics helps uncover repeat causes, such as:
- Inconsistent setup and changeover execution that creates micro-stops and unstable startups
- Progressive wear that increases small interruptions long before a breakdown happens
- Parameter drift that slowly reduces speed or increases defects during a run
- Material variation that pushes the process closer to its limits and increases stoppages
- Maintenance timing and quality issues that lead to repeat failures after “repairs.”
When these drivers remain invisible, plants rely on intuition and end-of-shift summaries. When analytics connect machine behavior to context, repeat disruption becomes measurable and preventable.
How OEE software helps stabilize OEE across lines
Many manufacturers track OEE, but fewer use it as an operating system. The difference is not the metric itself. The difference is whether the organization can consistently capture losses, understand why they recur, and apply improvements across multiple lines without changing the rules every time.
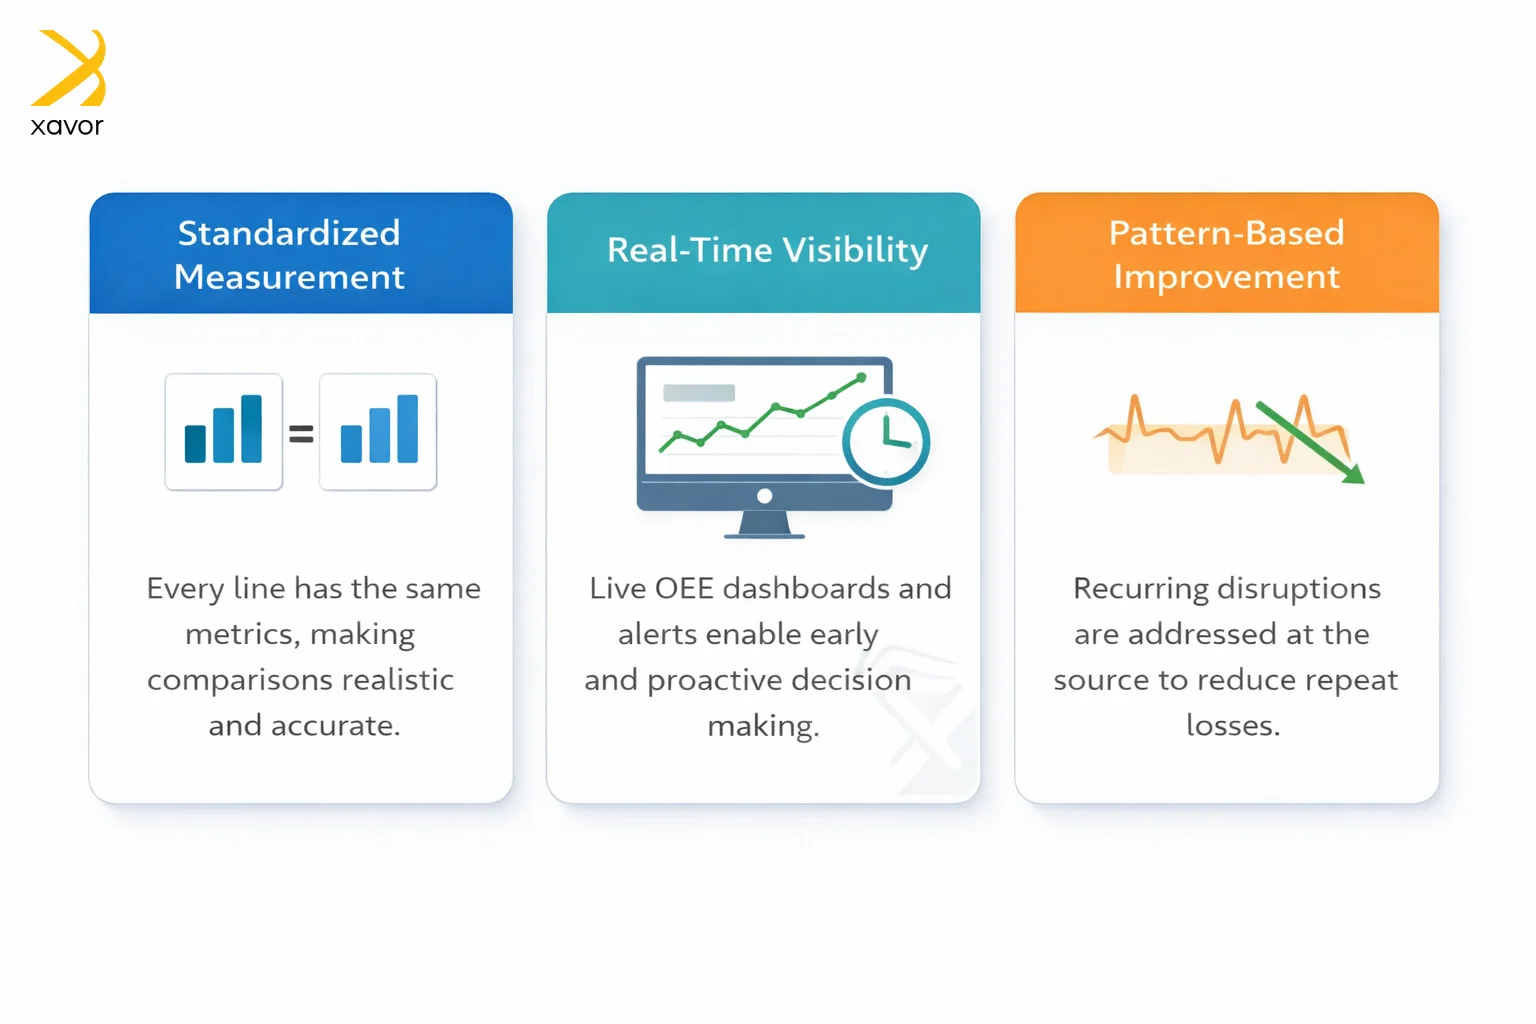
Custom OEE software supports stability in three connected ways:
Standardized measurement that makes comparisons reliable
Stability starts with consistent measurement. If downtime categories differ by line, OEE comparisons become misleading. If micro-stops are captured on one line but ignored on another, the performance loss stays hidden, and results look better than they really are. This is where OEE tracking software for manufacturing becomes essential because it applies consistent rules for availability, performance, and quality losses across all lines.
Visibility that helps teams intervene earlier
Operations cannot stabilize what they cannot see in time. Many losses build quietly during the shift through slow cycles, short interruptions, and unstable restarts. By the time end-of-day reports are reviewed, recovery options are limited. OEE dashboard software addresses this by showing live performance and loss trends as they happen. That visibility improves escalation and containment because teams can act sooner, and earlier action usually means smaller disruptions and less downstream impact.
Pattern-based improvement that reduces recurrence
Stability improves when teams stop treating stops as isolated incidents and start treating them as repeatable patterns. Plant-wide OEE reporting software helps by tying events to production context, such as product, recipe, shift, and operating conditions. When the same disruption repeats under the same conditions, the pattern becomes clear. Teams can then target the root cause, validate whether recurrence drops after corrective action, and standardize the fix across lines. Over time, this is how OEE becomes consistent rather than temporarily improved.
Using predictive maintenance to prevent repeat downtime
Real-time monitoring helps when a disruption starts. Predictive maintenance helps before disruption starts. That is the difference between containing today’s loss and preventing the same loss from returning next week.
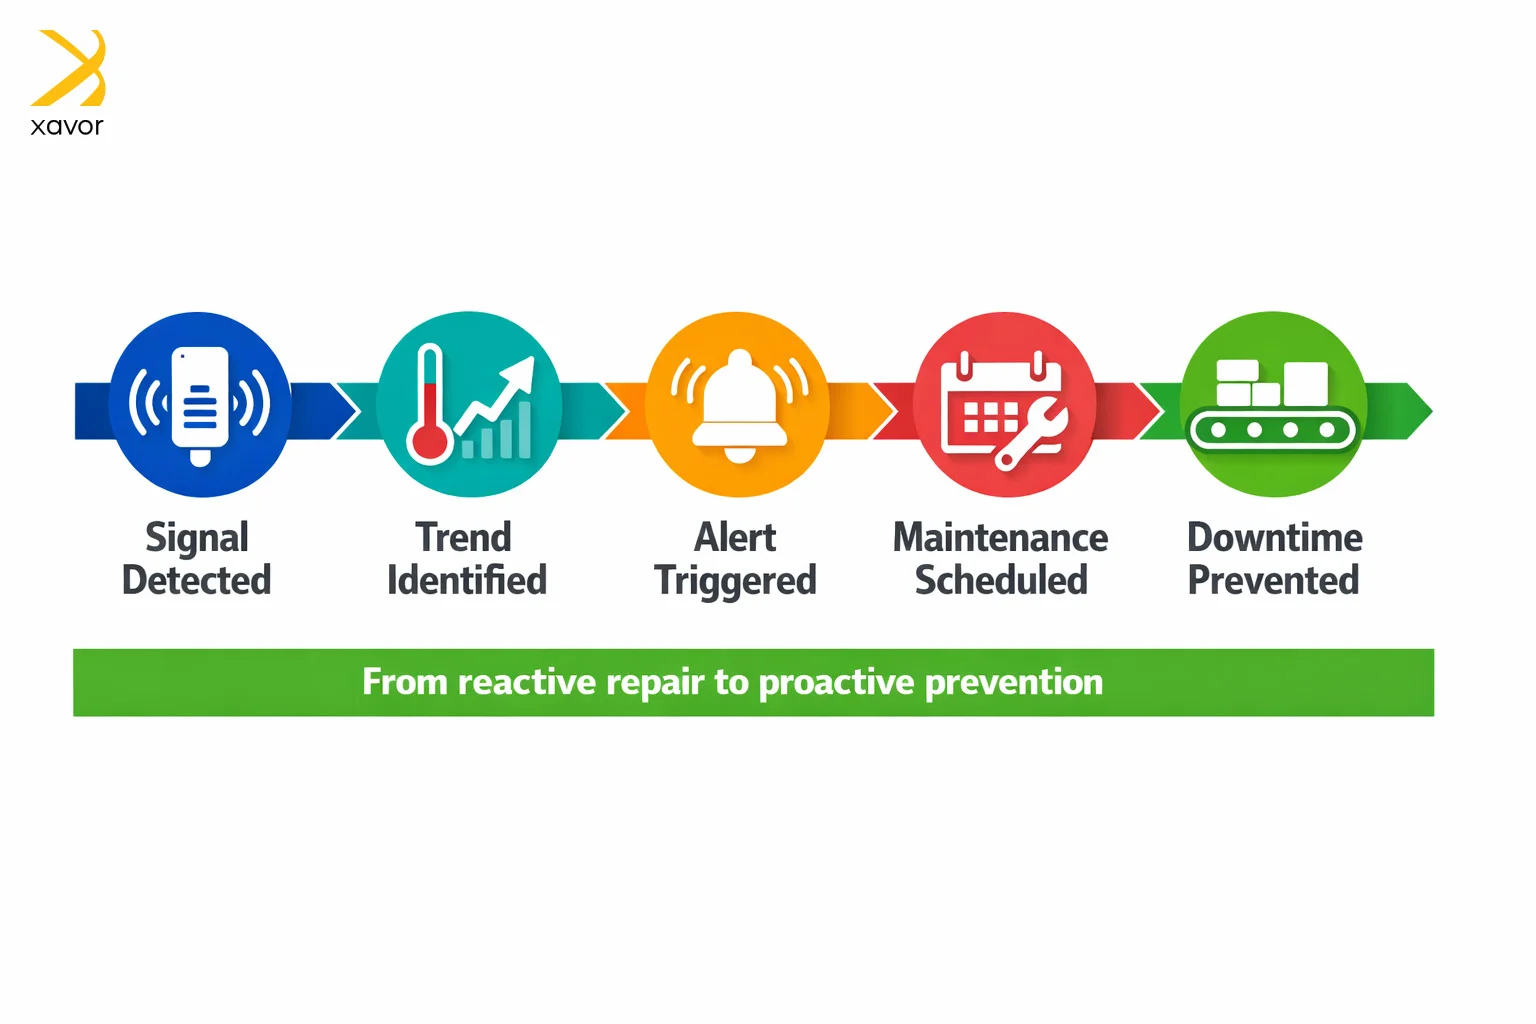
Most breakdowns do not appear out of nowhere. Equipment usually shows small changes before it fails. Small changes, such as rising motor temperature, increased bearing vibration, or slight cycle-time inconsistencies, often appear while the line is still running. These signals are easy to miss during daily operations because nothing has yet fully stopped, and people are focused on keeping production moving.
Predictive maintenance exists to catch these signals early and act before the breakdown becomes downtime.
What predictive maintenance analytics actually look for
Predictive maintenance analytics software tracks trends that indicate changes in equipment health over time. The goal is not to predict an exact failure moment. The goal is to detect rising risk early enough to plan maintenance.
Most programs start with signals like these because they are practical and measurable:
- Vibration patterns that change as bearings, motors, or rotating equipment degrade
- Temperature drift that suggests friction, lubrication issues, or load stress
- Cycle-time variability that signals resistance, misalignment, or mechanical instability
- Alarm frequency changes that show the system is entering abnormal operating states
How does this prevent repeat downtime instead of reacting to it
Predictive maintenance software for manufacturing converts these trends into alerts that tell teams which asset is trending toward failure and how quickly risk is increasing. This gives maintenance a chance to schedule work during planned windows instead of responding during a production emergency. Asset health monitoring software supports this by keeping condition trends visible continuously, so issues do not remain hidden between inspections or only show up after the machine stops.
When predictive maintenance is used consistently, the outcome becomes straightforward. Emergency breakdowns are reduced because risk is addressed earlier. Repairs become faster because planning improves, and troubleshooting time drops. Availability becomes steadier because the operation faces fewer surprise events. As a result, OEE becomes more stable across lines because the largest availability swings occur less frequently.
Building Enterprise OEE Visibility Across Lines and Sites
Predictive maintenance helps reduce downtime at the equipment level. The next challenge is making sure the entire operation improves consistently. Many organizations fix one line, but OEE remains unstable across other lines because measurement and improvement practices are not aligned.
Why visibility must be consistent across lines
OEE cannot be stabilized across lines if each line measures loss differently. When downtime categories vary, comparisons become misleading. When micro-stops are captured on one line but not another, performance loss stays hidden. When ideal cycle standards differ, OEE becomes a reporting discussion instead of an improvement tool.
Enterprise OEE visibility solves this by applying the same rules, loss categories, and performance standards across lines. That creates fair comparisons and makes it easier to identify the source of instability.
How multi-site tracking makes stability scalable
For organizations with multiple facilities, multi-site OEE tracking software extends that same consistency across locations. It allows leaders to benchmark fairly, replicate what works faster, and spot recurring issues across similar equipment before they become widespread.
When insight is shared and measurement is standardized, stability stops being a local achievement. It becomes an operational capability across lines and sites.
Measuring success: How to know stability is improving
A stable OEE program focuses on repeatability rather than isolated peaks. Success should show up in reduced variation, not just improved averages.
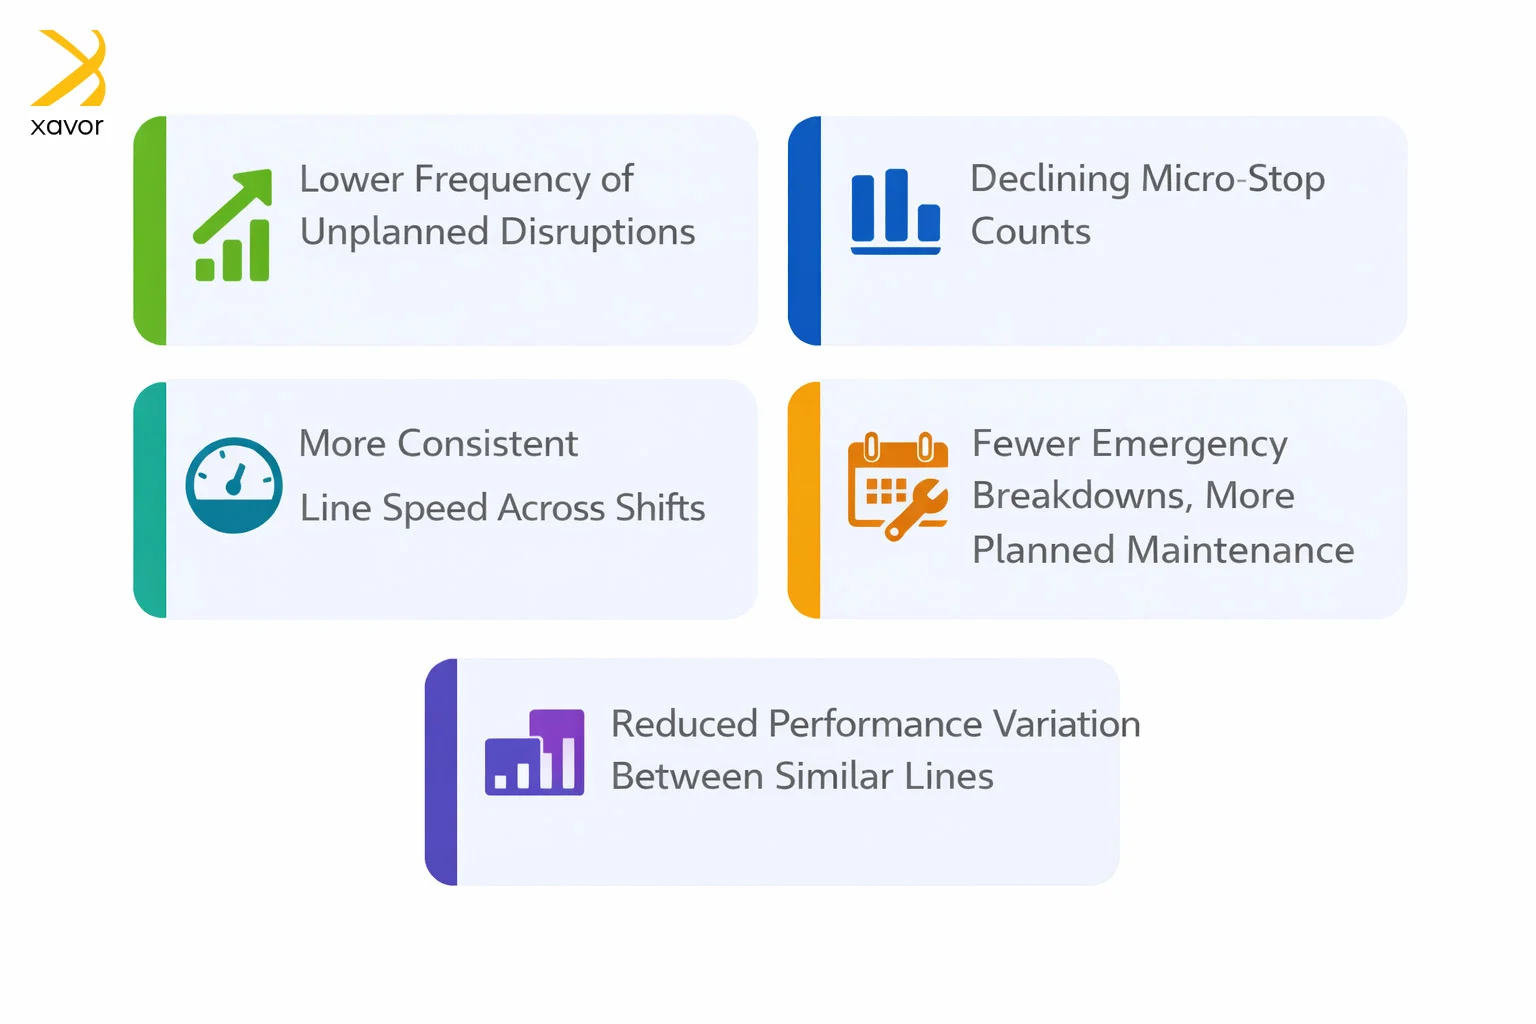
You should begin to see:
- Lower frequency of unplanned disruptions
- Declining micro-stop counts
- More consistent line speed across shifts
- Fewer emergency breakdowns and more planned maintenance
- Reduced performance variation between similar lines
When these indicators improve together, OEE becomes predictable and reliable for planning. That predictability is the real outcome of manufacturing data analytics and custom OEE software.
Conclusion
Manufacturing does not fall behind because people are not trying hard enough. It falls behind when small problems stay hidden until they suddenly become a stop, a delay, or a quality spill that derails the whole day. Data analytics makes those problems visible early, connects them to the conditions that trigger them, and helps teams fix the real cause instead of restarting the same cycle after every disruption.
When every line measures losses the same way, and everyone can see what is happening in the moment, performance becomes repeatable instead of random. Predictive signals guide maintenance before breakdowns hit, proven fixes spread faster across lines and sites, and output becomes dependable enough to plan around. That is what stability looks like: fewer surprises, smoother shifts, and OEE you can trust.
If you want to stabilize OEE across lines and cut unplanned disruptions with practical, shop-floor-ready analytics, Xavor can help. Reach out at [email protected] to explore an approach that fits your production environment.

FAQs
Manufacturing data analytics reduces disruptions by revealing repeat patterns and linking downtime events to operating conditions and production context. This helps teams eliminate root causes instead of repeatedly reacting to symptoms.
OEE software standardizes measurement across lines, supports real-time visibility, and enables consistent reporting and analysis. This improves comparability, speeds up response, and supports repeatable improvement that stabilizes results.
Predictive maintenance reduces surprise breakdowns by detecting early warning signals and enabling planned intervention. This stabilizes availability and reduces large swings in OEE caused by emergency downtime.