A case study to Shift from Unsupervised Learning to Supervised
In the financial data domain, whenever we have business goals to be met precisely as the stakeholder’s demand, there might be the chance that we don’t have the data domain aligned to those goals.
Sometimes we have data without labels or the outcomes that can be utilized in preparing the models. Several workarounds to address this problem totally depend upon the KPIs we are addressing. Some data experts believe that simple rule-based KPIs are fine with intense supervision of financial analysts can help and then, over time, improve the rules.
Some devise semi-supervised machine learning models and artificial intelligence solutions where they get a small portion of data verified and annotated, then use it to train the models. Suppose we don’t have any kind of supervision or annotation in the future.
In that case, Anomaly detection algorithms along with supervised models can replace the supervised models temporarily quite for some time.
What is Anomaly detection?
Anomaly detection refers to the process of detecting unexpected, unprecedented, and rare events in a data set. These are commonly known as anomalous events. Finding data anomalies is helpful because it paints a clear picture of the data. It is a fundamental concept behind many applications, mainly in real-time apps. Spotting anomalies in health, infrastructure, and processes is crucial for security and fintech apps.
Some notable Anomaly Detection algorithms:
-
Isolation Forest (ISO Forest)
It isolates observations through a random selection of features. And then randomly selects a split value in-between maximum and minimum values of the chosen feature. Recursive partitioning or division is presentable in the form of a tree structure. The total number of splits needed to isolate a sample equals the path length from the root to the terminating node.
-
Cluster-based Local Outlier Factor (CBLOS)
CBLOF takes data as the input and generates a cluster model through a clustering algorithm. It categorizes one cluster into several small and large clusters with the help of alpha and beta parameters. It then calculates the anomaly score by considering the cluster size of the point and its distance to the nearest large cluster.
-
Histogram-based Outlier Detection (HBOS)
It is another efficient yet unsupervised method for anomaly detection. HBOS calculates the degree of outlyingness based on feature independence and histograms.
How to shift from Unsupervised model to Supervised?
The method intends to separate the anomalies and separately create an anomaly model for every KPI so that we can create labels for every KPI. The model will tell us whether the specific transaction is risky in light of that KPI. The transaction can be difficult in light of multiple KPIs, or it can be difficult in one KPI and non-risky in another.
Data preparation steps are as similar as common data science problems; that is why a standard layer should be prepared to be used in unsupervised model preparation and in supervised model preparation. Data cleaning to Feature extraction is generally a common layer, then unsupervised models and supervised models can utilize them to develop the models.
Data Extraction and Preparation
The data lies typically in databases or cloud platforms in different settings. One must design the data pulling job carefully to include the important columns. This is a very critical job for Data engineers as well as Data scientists. If we dive into this topic, our original focus of this blog will shift as it is a very challenging problem, and its details are overwhelming.
Once the data is available to the data scientist, the first and foremost step is to realize the column types and their nature. There might be some columns that are usable for later stages, like data, time, etc., or maybe obliterated. One can then identify and correct the types.
Data cleaning includes cleaning ‘nan’ values, data imputation column to column basis, converting numeric to float, removing outliers, and performing data discretization if necessary.
Some other steps:
- Convert known category variables to categorical
- Add ‘year’ and ‘month’ features for later usage
- Run Pandas’ describe’ method to pull basic stats about the variables
- Print top values and other information for variables
Correlation Analysis
Sample the data for further testing and skew measures. In this way, the distribution of the column can be accurately visualized and corrected if skewed not evenly.
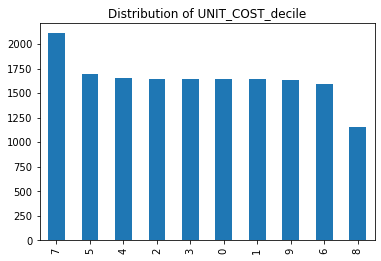
Run correlations of categorical and numeric features to identify and remove overly correlated features. We must carefully select the correlated columns. There might be a case where two columns correlated strongly; we might choose the wrong column which does not align with a business goal. Besides correlation analysis, columns must be selected according to the model’s requirement and the use case.

Dealing with textual features. Here are the steps to follow:
Fix the text features with standard tfidf vectorizer parameters
- Review the vocabulary for abbreviations that can be normalized
- apply case, space, and punctuation normalizations
Normalize reduced variable set based on correlation and skew
- Convert categorical features to encoded vectors for machine-readable input
- Convert numeric features to scaled versions so that numeric features all cover the same range of values between 0 and 1
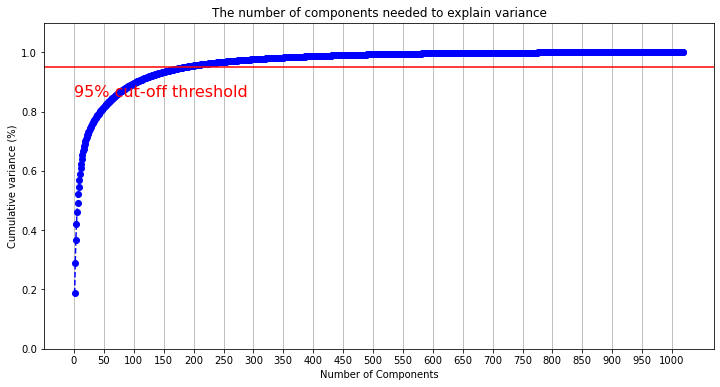
Also, run the Principal Components Analysis Explained Variance measure and graph to choose the component count cut-off
Choose number of PCA components based on PCA explained variance intersection at 95% variance.
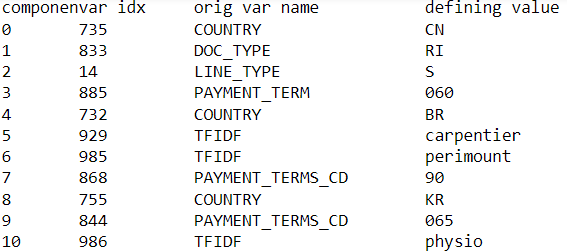
Identify the most weighted contributing feature and category from each PCA component. Also, you can always backtrack and see which columns are preferable to use in models. PCA has simplified this feature selection process by this mechanism.
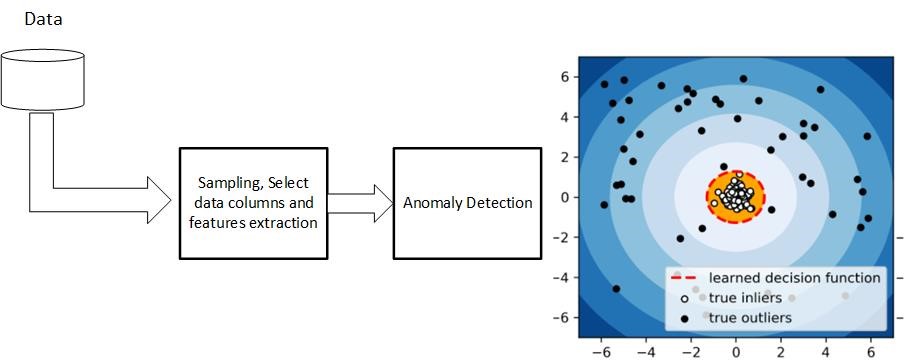
Train Anomaly detection Algorithms
For every KPI, train separate anomaly detection algorithms so that we can identify the different risks at different levels.
It is always a good practice to separate Train, Validation, and Test Set. But from where we would identify the correct working of the model. Remember if we can make simple rules of KPIs and mark the data with those rules. These can serve as weak comparison benchmarks. So, in this way, we can always verify whether the model is performing the theme in Validation and Test Set training. Moreover, apart from the PYOD and sklearn library given parameters to check the model performance, this additional step can ensure the model is trained accurately.
Training supervised models
Through the data and its nature, ml models can be easily selected. Therefore, the metrics must be precision, recall, and F1 to measure risky/non-risky behavior against every KPI. Models like XGBoost, Neural Nets, Random Forest, Gradient Boosting Classifier, and Support Vector Machine (SVM) can be tried to check which ones are the better candidate.
Moreover, two libraries can be compelling in optimizing the models and explaining the model’s features. Optuna is very powerful tool for selecting the optimum hyperparameters to maximize the classification accuracy.
The other tool, SHAP (SHapely Additive exPlanations), is a tool of explainable AI to explain the model’s outputs.
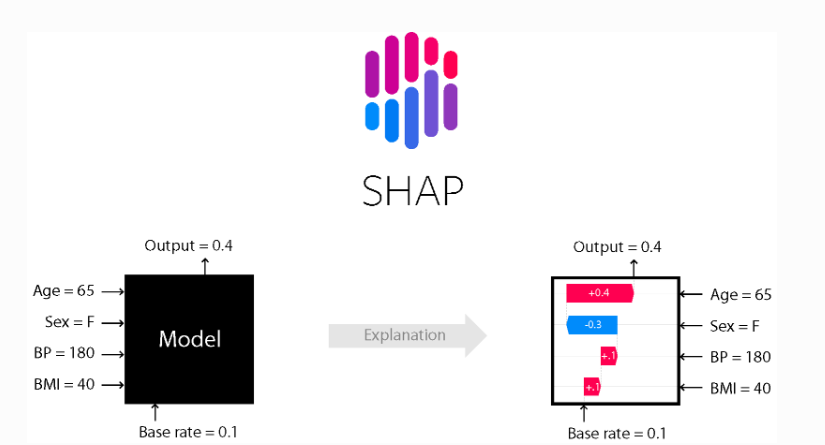
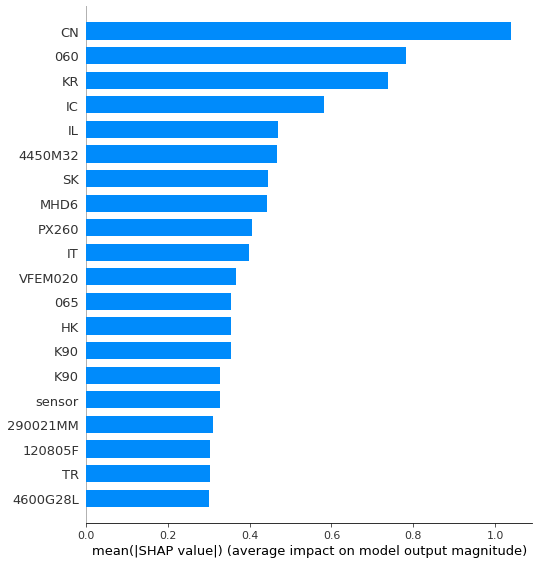
So, the important columns and their impact are identifiable through the SHAP, and we can eliminate those columns with low impact in modeling.
Advantages of using the Supervised model instead of Anomaly models
We are not using anomaly detection algorithms in production. Instead, we intend to use the labels generated and train a multi-label machine learning model. The reasons for that are:
- Instead of several models, only one multi-label will address all KPIs, and the computation cost would decrease.
- Training one model will be beneficial once we have the human-level annotation. Also, the shift from unsupervised to supervised learning will be much easier. The labels will then easily fine-tune or re-train one model instead of several anomaly models.
- Multi-label classification will open doors to several varieties of models for each KPI instead of limited choice in clustering or anomaly algorithms.
- Metrics will be adequately defined, and you can measure the accuracy for each label much more quickly and easily.


