

Our web development services have dealt with slow Umbraco sites before. The cause of site sluggishness is rarely Umbraco itself. Sometimes frequent database calls drag down performance. Excessive indexing and heavy scheduled jobs affect performance as well. Not to mention uncached content, which is an overlooked detrimental factor. The fix is to backtrack on these performance issues until you find a solution before adding more infrastructure.
There is nothing more that drives online users away than a slow website. Just a few seconds of delay is enough for someone to bounce off. Plus, a slow website costs you potential customer conversions and a drop in search rankings. All of which reflects badly on your business’ credibility.
But Umbraco is a fast, capable CMS built on ASP.NET Core, and most performance problems have well-understood fixes.
This guide walks through the seven most common reasons Umbraco sites slow down, and exactly what to do about each one.
First, find out where the time is going
You first need to do a prognosis of your Umbraco site by identifying where the slowdown is happening. Guessing at performance problems wastes effort and can make things worse.
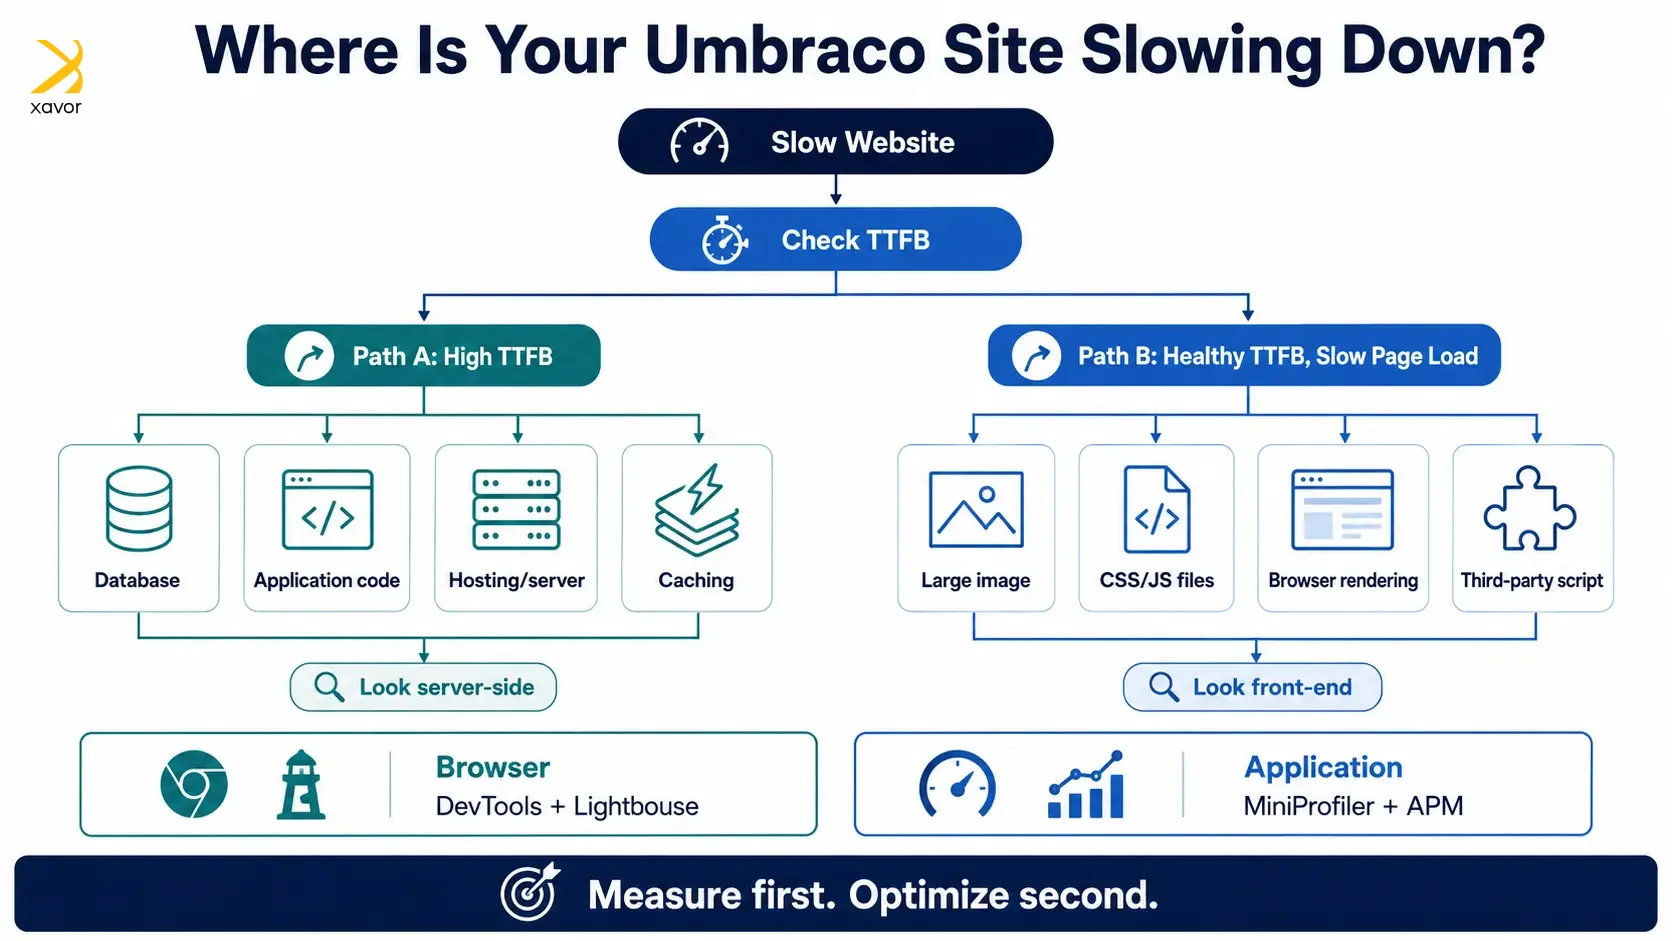
Start with:
- Browser DevTools (Network + Lighthouse)
Browser DevTools and Lighthouse help determine what’s slow on the front end. These can reveal large assets, render-blocking resources, slow requests, and other front-end performance problems..
- Time To First Byte (TTFB)
TTFB separates server-side slowness from front-end slowness. If TTFB is high, the browser is spending too long waiting for the server to respond, which points you toward application code, database access, hosting, or caching.
On the other hand, healthy TTFB with longer page load time hints that front-end assets and rendering deserve more attention.
- Internal app tools
Use Umbraco logging, MiniProfiler, or an Application Performance Monitoring tool such as Application Insights or New Relic. These tools help expose slow requests and expensive operations that may not be obvious from the browser alone.
Regular performance monitoring is particularly useful because it lets you identify recurring bottlenecks rather than diagnosing every incident from scratch.
Once you know whether the problem is server-side, front-end, or media, the fixes below become obvious.
The site is slow in production only
If the site performs well locally but slows down in production, look at factors that change between environments. These can include traffic levels, SQL latency, disk I/O, hosting configuration, excessive database calls, or ineffective caching.
Rather than immediately upgrading the server, use profiling and monitoring data to identify the actual bottleneck.
The site is slow locally too
If the problem appears locally as well, the application itself is more likely to be responsible. Check custom code, third-party packages, HTTP modules, templates, and expensive queries.
A useful approach is to temporarily remove or simplify components and then add them back gradually. When performance drops again, you have a much clearer idea of what needs to be refactored.
7 common bugs that drag Umbraco website performance
7 holds a very special status in the numerology of many cultures. It is often called the magic number. Unfortunately, there is nothing magical about the seven issues below.
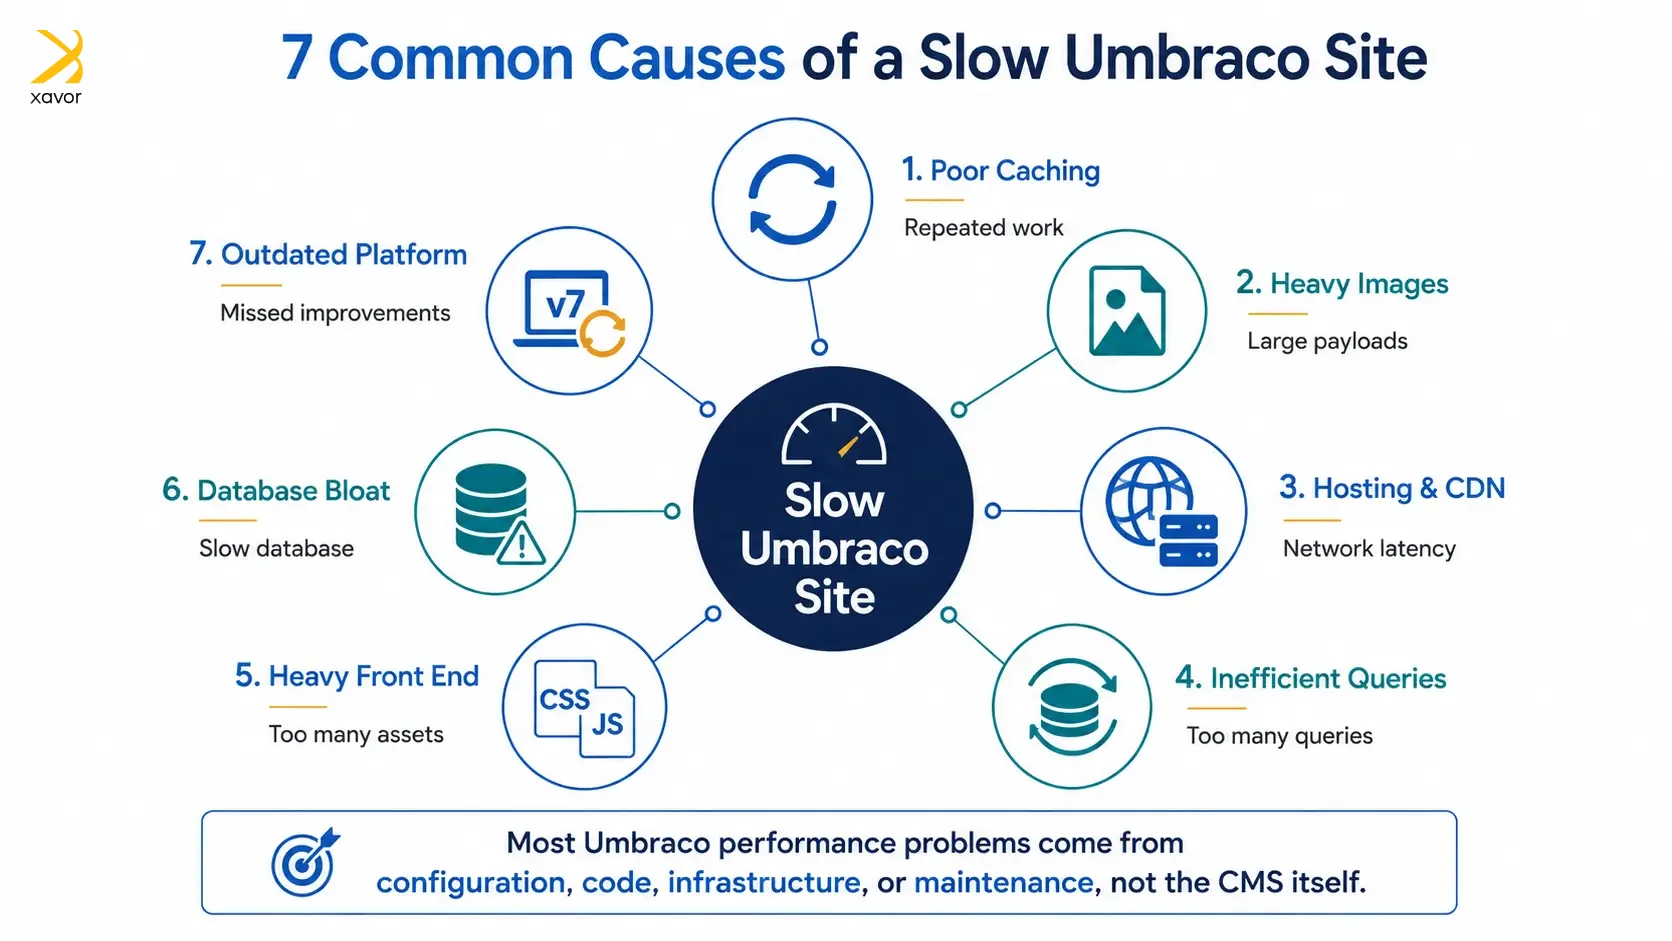
Each can quietly drag down your Umbraco website performance, often without an obvious warning sign. The good news is that once you know where to look, most of them are much easier to diagnose and fix.
1. Caching isn’t configured properly
The single most common cause of a slow Umbraco site is missing or misconfigured caching. Umbraco’s published content is served from an in-memory cache (NuCache / the published cache), which is fast, but performance still suffers when:
- Output caching isn’t used for expensive pages or components.
- You’re bypassing the published cache by querying the database directly on every request.
- Response caching and browser/CDN cache headers aren’t set, so nothing is cached downstream.
The fix:
Serve content from the published content cache rather than direct database queries. Add output/response caching for expensive views and partials. Set sensible Cache-Control headers so browsers and your CDN can cache static and semi-static responses.
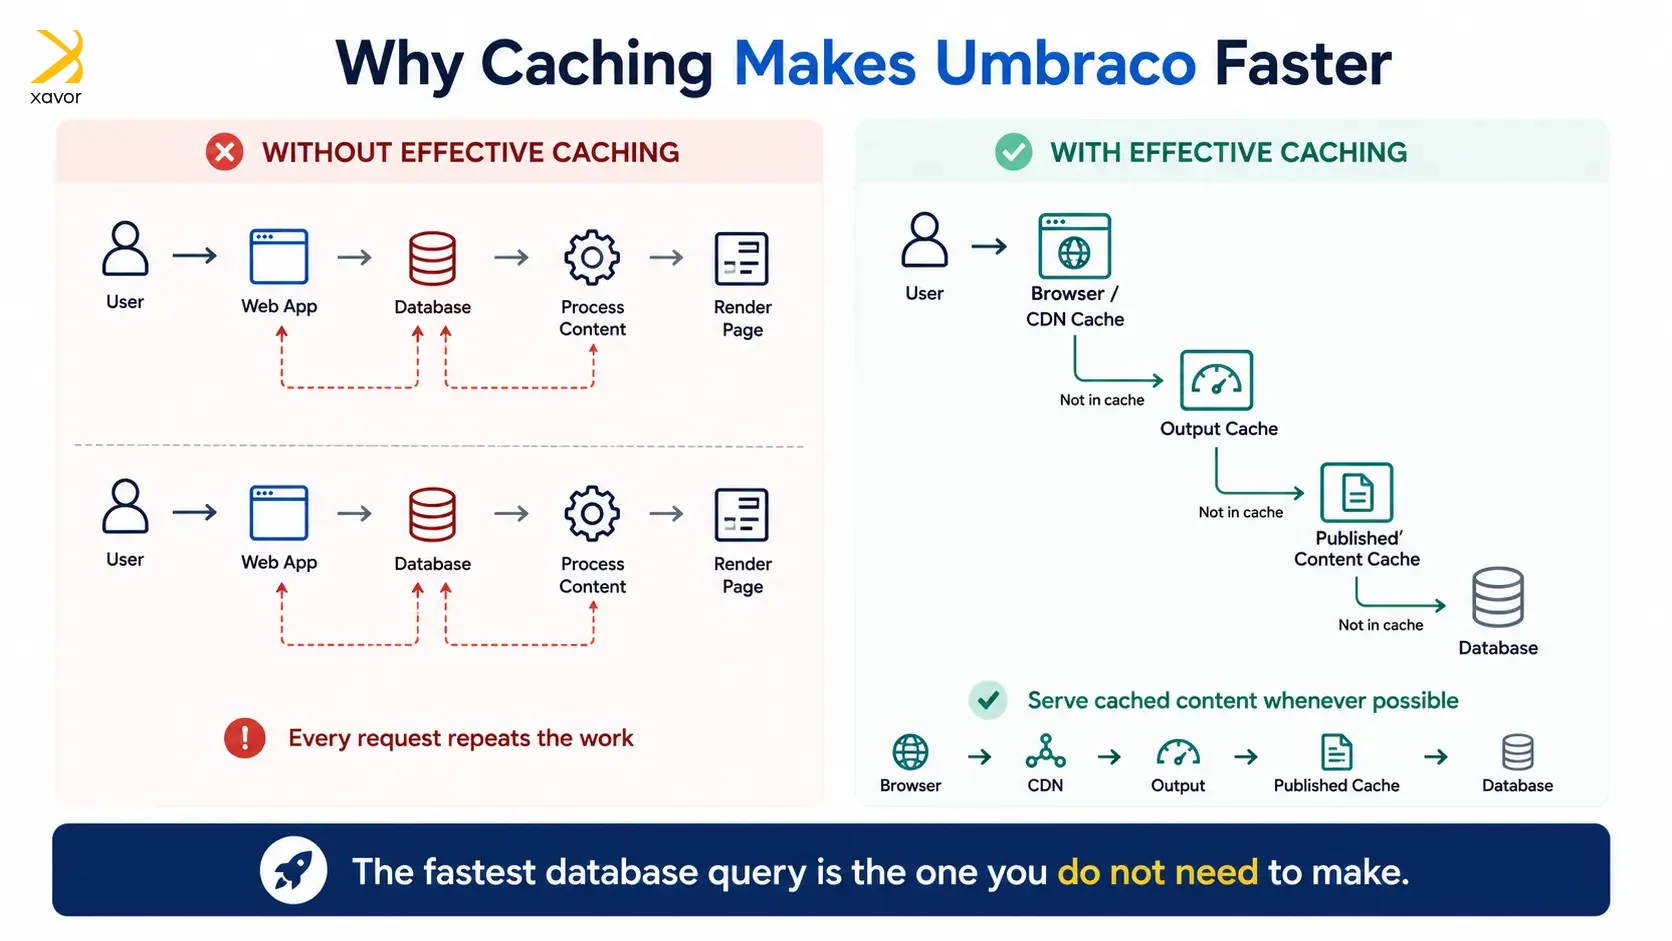
For frequently reused, expensive lookups, cache the results in memory rather than recomputing them per request.
2. Unoptimized images and media
Media is the number-one cause of heavy, slow-loading pages. A single hero image exported straight from a designer’s tool can be several megabytes — larger than the rest of your page combined.
The fix:
- Use Umbraco’s ImageSharp-based image processing to resize and compress images on the fly (?width=, ?quality=) instead of serving full-resolution originals.
- Serve modern formats like WebP or AVIF where supported.
- Implement lazy loading (loading=”lazy”) so off-screen images don’t block the initial render.
- Deliver media through a CDN so it’s served from an edge location close to the user.
3. No CDN or poor hosting
Where and how your site is hosted has an outsized impact. Underpowered shared hosting, a database on a separate slow network hop, or a single server far from your users all add latency.
The fix:
- Host on infrastructure sized for your traffic — Umbraco Cloud or Azure App Service with an appropriately sized plan.
- Keep the web app and its SQL database in the same region to minimize round-trip latency.
- Put a CDN (Azure Front Door, Cloudflare, etc.) in front of the site for static assets and cached responses.
- Enable HTTP/2 or HTTP/3 and response compression (Gzip/Brotli).
4. Inefficient content queries and code
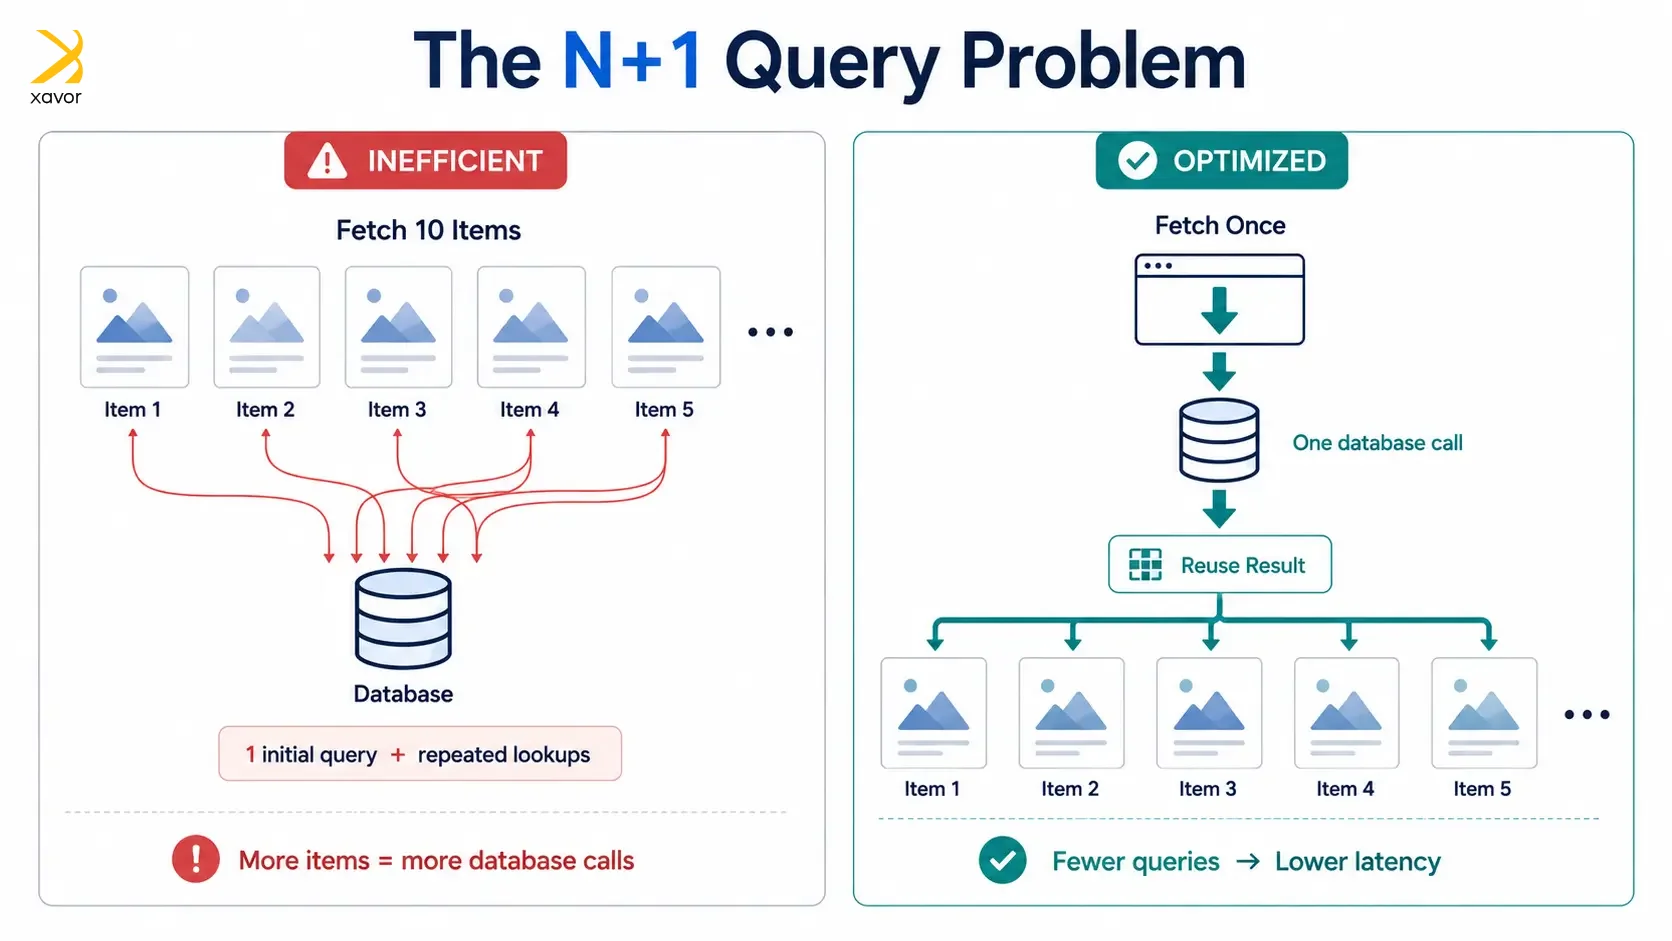
Poorly written templates and controllers can quietly cripple performance. The classic culprit is the N+1 query problem — looping over content and triggering a separate lookup on each iteration.
The fix:
- Query the published content cache (IPublishedContentQuery / content APIs), not the database, on the front end.
- Avoid deep, repeated traversals of the content tree inside loops; fetch what you need once and reuse it.
- Use Examine (Umbraco’s built-in search index) for listing, filtering, and search-heavy pages instead of walking the content tree at runtime.
- Profile with MiniProfiler to catch expensive operations before they reach production.
5. Too many (or heavy) front-end assets
Even a fast back end feels slow if the browser has to download and parse a mountain of CSS and JavaScript, or fire dozens of separate requests.
The fix:
- Bundle and minify CSS and JavaScript to cut request counts and file sizes.
- Remove unused libraries, plugins, and packages you’re no longer using.
- Defer or async non-critical scripts so they don’t block rendering.
- Audit third-party scripts (analytics, chat widgets, tag managers) — they’re a frequent, invisible source of slowdown.
6. Database bloat and index problems
Over time, the Umbraco database accumulates old content versions, logs, and audit history. A large, unmaintained database — or one missing appropriate indexes — makes back-office operations and content-heavy queries drag.
The fix:
- Keep content version history trimmed (Umbraco can automatically clean up old versions).
- Regularly clear old audit and log entries you don’t need to retain.
- Ensure the database has proper indexing and up-to-date statistics; work with your DBA on maintenance plans.
- Rebuild or examine indexes if search or listing pages behave slowly or return stale results.
7. Running an outdated Umbraco (or .NET) version
Older Umbraco versions — especially those on the legacy .NET Framework rather than modern .NET — miss out on years of performance improvements in both the CMS and the underlying runtime. Staying current is one of the highest-leverage things you can do.
The fix:
- Upgrade to a supported, modern Umbraco version running on current .NET.
- Keep packages and dependencies updated (test in staging first).
- Take advantage of newer performance features and caching improvements that ship with each release.
- Treat upgrades as routine maintenance, not a once-every-few-years emergency.
A simple prioritization order
Fixing a website isn’t easy. So, it’s not a big problem if you’re not sure where to start. Tackle them in the order of biggest-impact-for-least-effort:
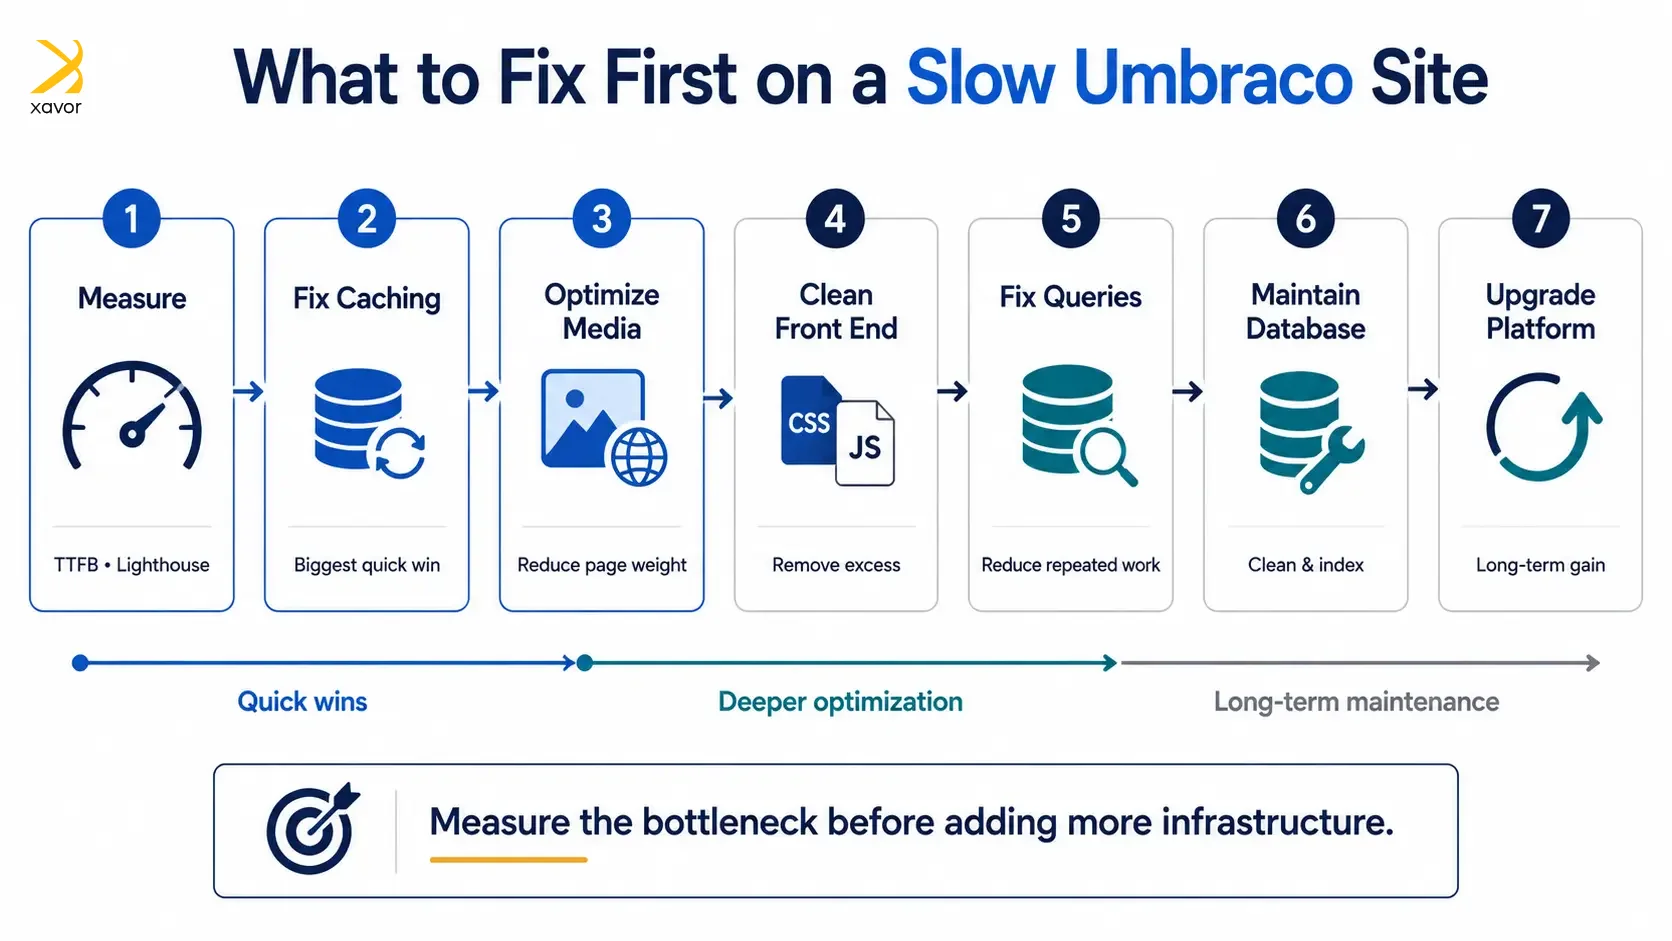
- Measure (TTFB, Lighthouse, profiling) — know your actual bottleneck.
- Fix caching — usually the fastest, biggest win.
- Optimize images and add a CDN — huge front-end gains.
- Clean up front-end assets.
- Fix inefficient queries and code.
- Maintain the database and indexes.
- Plan the version upgrade for long-term gains.
Why Umbraco and why Xavor
A slow Umbraco site is rarely a sign that the platform itself cannot keep up. More often, the slowdown can be traced to how the site has been built, configured, hosted, and maintained over time.
That is why improving Umbraco performance should start with diagnosis. Measure where the time is going, identify the real bottleneck, and then address the areas responsible for it. In many cases, fixing just a few high-impact issues can make a noticeable difference without requiring a larger hosting environment.
Performance also needs ongoing attention. As content grows, integrations are added, traffic increases, and the platform evolves, new bottlenecks can appear. Regular monitoring, database maintenance, dependency updates, and performance reviews help keep an Umbraco site responsive rather than waiting for problems to become visible to users.
This is where Xavor can help. We look at Umbraco performance as a connected system, examining the application, database, hosting environment, caching, media, and front-end experience to determine what is actually slowing the site down.
Contact us at [email protected] to talk to our web experts if you’re not sure which of these issues is dragging your site down. Our experts provide a free consultation with a list of what to fix first.

FAQs
An Umbraco website can become slow because of poor caching, excessive database queries, oversized images, inefficient custom code, heavy front-end assets, database bloat, or hosting issues. The cause is rarely Umbraco itself. A performance audit can identify whether the bottleneck sits in the application, database, front end, media, or infrastructure.
In many cases, yes. A slow Umbraco website does not automatically need a rebuild. Xavor can improve performance with a few quick, effective solutions. Fixing caching, optimizing database queries and images, removing unnecessary scripts, improving hosting configuration, and refactoring inefficient code often do the job. Our first step is to profile the existing site and identify what is actually slowing it dow
The improvement depends on what is causing the slowdown. A site affected by poor caching, oversized media, or inefficient queries may see significant gains once those bottlenecks are fixed. Rather than promising a fixed speed increase, we measure performance before and after optimization using metrics such as TTFB, Core Web Vitals, and server response times.