
Modern Java applications run in complex environments where performance issues are not always easy to spot, especially when they are powering an enterprise web presence. A single user request can pass through web servers, containers, microservices, and databases before a response is returned. When something slows down, teams often end up checking logs, metrics, and dashboards across multiple tools, which makes troubleshooting time-consuming and frustrating.
Dynatrace helps simplify this challenge by providing clear visibility into how your Java application and its supporting infrastructure behave in real time. With automatic discovery and intelligent monitoring, it shows how different components interact and where problems actually originate. In this article, you will learn what Dynatrace is, how it works, and how to integrate it with a Java-based application to monitor performance, improve stability, and deliver a better user experience.
What is Dynatrace?
Dynatrace is a comprehensive software intelligence monitoring platform that simplifies the complexity of enterprise cloud systems and accelerates digital transformation efforts. By harnessing the power of Davis, the AI causation engine developed by Dynatrace, along with complete automation capabilities, the all-in-one Dynatrace platform goes beyond providing raw data and delivers meaningful insights regarding application performance, underlying infrastructure, and end-user experience.
Organizations rely on Dynatrace to modernize and automate their cloud operations, streamline software releases with enhanced quality, and ensure optimal digital experiences for their customers.
Dynatrace seamlessly integrates infrastructure and cloud monitoring, application performance monitoring, and digital experience monitoring, creating a unified and automated solution driven by artificial intelligence. This solution empowers development, operations, and business teams by offering a shared platform and metrics, thus serving as the definitive “source of truth” for organizations aiming to achieve exceptional performance outcomes.
This article explains Dynatrace, its uses, how it works, and how you can integrate it with a Java-based application.
Uses of Dynatrace
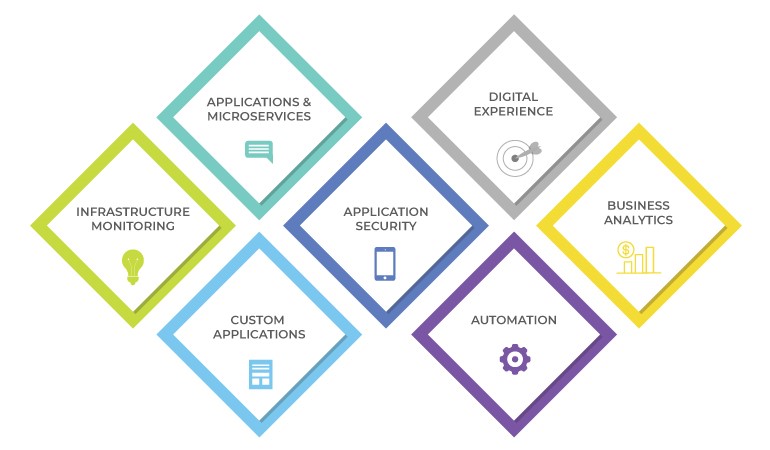
Dynatrace is an all-in-one platform that’s purpose-built for a wide range of use cases.
-
Infrastructure Monitoring
Dynatrace simplifies and automates infrastructure monitoring, offering comprehensive visibility into your virtual machines (VMs), hosts, networks, containers, logs, and events. It continuously discovers changes in your dynamic environment and gathers infrastructure metrics using the AI engine, Davis. Integrate Dynatrace streamlines the monitoring process by consolidating tools and reducing the Mean Time to Identify (MTTI).
-
Applications and Microservices
Dynatrace offers automated visibility at the code level and delivers root-cause analysis for applications deployed in complicated enterprise cloud environments. It effortlessly captures timing and code-related context for transactions across all tiers. Additionally, Dynatrace automatically detects and monitors microservices throughout the hybrid cloud ecosystem, spanning from mobile to mainframe platforms.
-
Application Security
As a software-intelligence monitoring platform, Dynatrace empowers you to enhance the speed and security of your application delivery by leveraging automated runtime application vulnerability management. This feature is specifically optimized for cloud and Kubernetes environments and helps ensure robust security measures while expediting the application development process.
-
Digital Experience Monitoring (DEM)
With Dynatrace DEM, you gain Real User Monitoring (RUM) capabilities for every customer journey. It provides synthetic monitoring across a global network and offers a 4K movie-like Session Replay feature, allowing you to analyze and optimize the digital experience of your users. It also enables you to provide enhanced customer support on all the digital channels, thus improving customer experience.
-
Business Analytics
By tying business metrics and key performance indicators (KPIs) to data that’s already flowing through Dynatrace’s application performance and digital experience modules, you get real-time, AI-powered answers to your critical business questions.
-
Automation
Dynatrace AIOps automates the process of providing accurate insights. By gathering high-quality data and continuously mapping dependencies in real-time, integrate Dynatrace enables its explainable AI engine, Davis, to identify precise root causes of issues or anomalies. This allows for swift auto-remediation and intelligent orchestration of cloud resources, streamlining operations and optimizing performance.
How it Works
Here is a list of essential concepts you need to understand to know how Dynatrace works.
- OneAgent services—it automatically discovers, activates, and instruments applications, microservices, infrastructure, and any dependency in modern cloud environments.
- PurePath distributed tracing— it captures and analyzes timing and code-level context for all distributed traces, end-to-end, across the full stack.
- Smartscape topology— a dynamic mapping of the environment that visually represents the evolving relationships among various components across all tiers.
- Grail data lakehouse— a causational data lakehouse equipped with a massively parallel processing (MPP) analytics engine. It utilizes Dynatrace Query Language (DQL) for instantaneous, AI-powered analytics with comprehensive contextual insights
- Davis Causal AI engine— it analyzes intricate relationships and dependencies within complex IT environments to provide precise answers prioritized based on their business impact. Davis informs you about the presence of a problem, its business implications, and its root cause, facilitating quick resolution.
Steps Required to Integrate Dynatrace with a Java Web App
Web applications comprise web pages that are delivered by web servers (such as Apache Tomcat) and web containers (such as Docker). When web requests are directed to a particular Tomcat server, it exemplifies a server-side service. Server-side services encompass a range of types, including web services, database requests, web containers, and custom services. Dynatrace OneAgent offers insights into the interactions between applications or services, revealing which services interact with each other and which services or databases a particular service calls.
Deploy application performance monitoring (APM) with third-party applications written in Java. It monitors the health of your distributed applications across every tier in a front-end application down to every database statement. Dynatrace automatically analyzes Java applications and detects and diagnoses problems in real-time.
Suppose a Java application is running on a virtual machine directly; install OneAgent on that virtual machine with the following steps to get started.
Install OneAgent on Windows
For Dynatrace SaaS customers, please navigate to Dynatrace.com, select the SaaS login option, and proceed to sign in. You can use the username and password provided to you by Dynatrace in the confirmation email received upon signing up.
If you’re a Dynatrace Managed customer, access the Cluster Management Console and choose the environment you want to monitor.
Then continue with the installation steps below.
Requirements and prerequisites
- To install OneAgent and modify firewall settings (required only if your internal routing policy prevents Dynatrace software’s access to the Internet), you need administrator privileges for the servers involved.
- You need permissions and credentials for restarting all your application services.
- You also need to verify the disk space requirements.
- The host on which you install OneAgent needs at least 200 MB RAM.
- OneAgent cannot be installed on networked storage mount points that are managed by protocols such as NFS or iSCSI.
- Depending on the type of Dynatrace deployment (SaaS or Managed) and your network configuration and security preferences, you have the option to either grant direct access to the Dynatrace cluster or establish an ActiveGate.
- For OneAgent version 1.253 and earlier, we recommend that you uninstall any existing WinPcap driver to allow Npcap installation—do this on all Windows versions, except for Windows Server 2019 build 1809 without hotfix KB4571748.
For OneAgent version 1.255+, Npcap is installed by default and may cause a network disruption on Windows Server 2016, Windows Server 2019 build 1809, and Windows Server 2019 build 1809 without hotfix KB4571748. To prevent such disruption, we recommend you upgrade your hosts with the hotfix KB4571748 or use other documented options.
Allow Connections Through the Firewall
Ensure that your firewall settings permit communication with Dynatrace. Depending on your firewall policy, it may be necessary to explicitly allow specific outgoing connections. The installation page for OneAgent provides the relevant remote Dynatrace addresses that need to be added to the allowed list.
Uninstall the WinPcap Driver to Allow Npcap Installation
If you currently have the WinPcap driver installed, we suggest removing it prior to installing OneAgent. You should let the OneAgent installer install the appropriate packet capture driver, Npcap, which is WinPcap’s successor. It is the recommended packet capture driver for network analysis in Dynatrace.
The Npcap driver bundled with the OneAgent installer seamlessly integrates its DLL library files with Dynatrace software, enabling convenient and automated updates.
Excellent! The setup is now complete, and you can explore your new monitoring environment. For SaaS customers, access your monitoring environment at any time by visiting the Dynatrace website and clicking the Login button located in the upper-right corner. If you are a Dynatrace Managed customer, you can access your monitoring environment through the Cluster Management Console.
One final step: To monitor your processes, it is necessary to restart them. You can always check which processes are not being monitored and require restarting. Simply select Deployment status from the navigation menu, click on either the All Hosts or Recently connected hosts tab, and expand the desired host to view the relevant information.
We hope this article helps you integrate Dynatrace with Java-based applications. In case you need further assistance, feel free to contact us at [email protected].

FAQs
Usually, no. Dynatrace OneAgent automatically instruments Java applications after installation. You mainly need to restart the Java processes so monitoring starts correctly.
First, restart the application services because OneAgent needs a process to restart to begin monitoring. Also confirm firewall access to Dynatrace endpoints and check Deployment status for connection and process details.
Yes, Dynatrace supports Java apps running on Apache Tomcat and in containers like Docker. It also helps trace requests across microservices and databases to quickly spot bottlenecks.